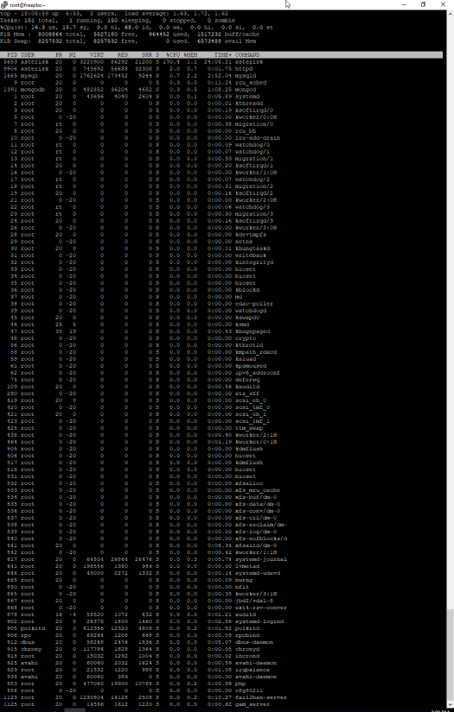
You can see that in screen fail2ban takes several minutes to drop down from 100% cpu usage.
I think I’ve narrowed down the issue to a fail2ban/firewall issue. As soon as an endpoint tries to many times with the wrong password asterisk then jumps to 100% or more indefinitely.
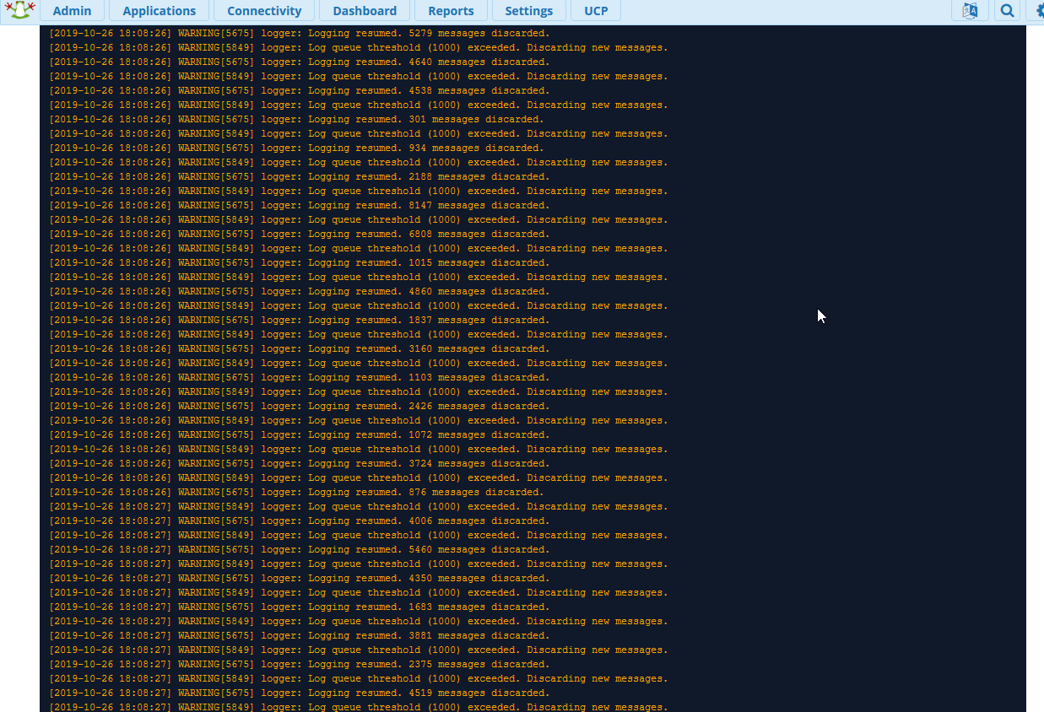
I thought I solved it as there were some emails sitting in the postfix queue but that wasn’t it. And then fail2ban spat out a bunch of banned IPs in an email but that didn’t solve it either.
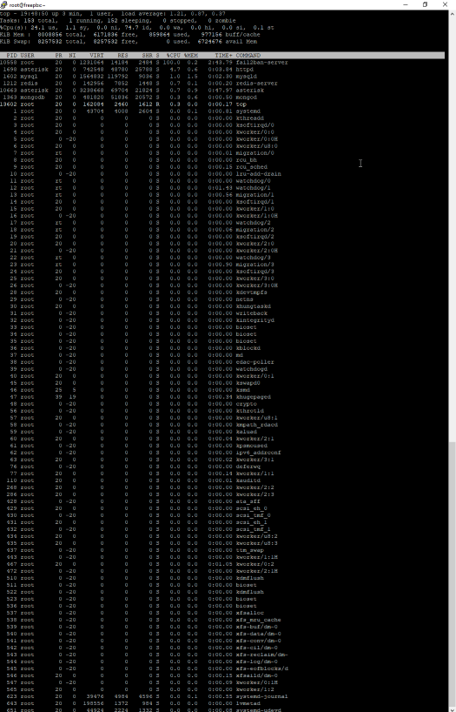
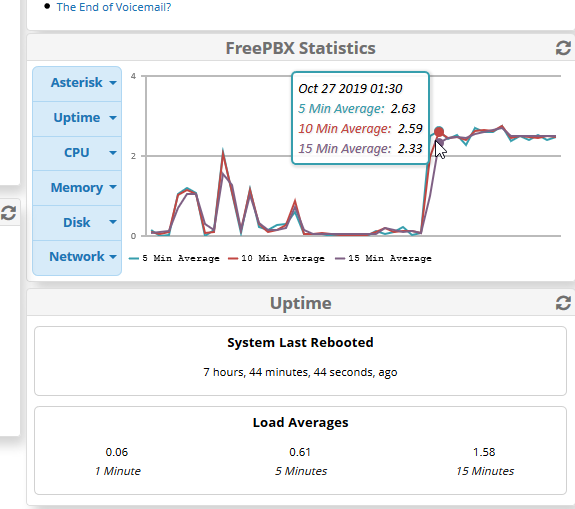
The strange part right now is that asterisk is sitting at 178% usage but when a call is placed (incoming or outgoing) the asterisk process usage drops to a meagerly 5% and call quality is fine. As soon as the call is done asterisk usage jumps back up to 178%.
I’m using the latest distro FreePBX 14 (build 1902 I think) and asterisk 16.4.1.
Any thougts @tonyclewis or other Sangoma team members?
Sorry I have nothing to do with Sangoma or the FreePBX project. Heck I was told I was not welcomed at Astricon anymore. First time in over 10 years I will miss it.
It’d be surprising that it would be fixed in 13.25.0 as it was released in February-ish of this last year, whereas 16.4.1 was released around July unless it was some sort of regression that was introduced. It sounds like it might be worth opening a bug report on issues.freepbx.org with your system info and relevant version of Asterisk that exhibits the issue.