Audio Drop and High CPU

Hello,

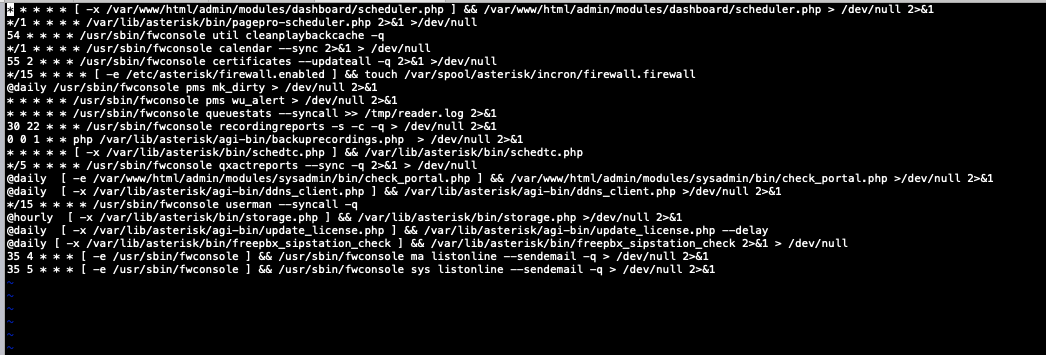
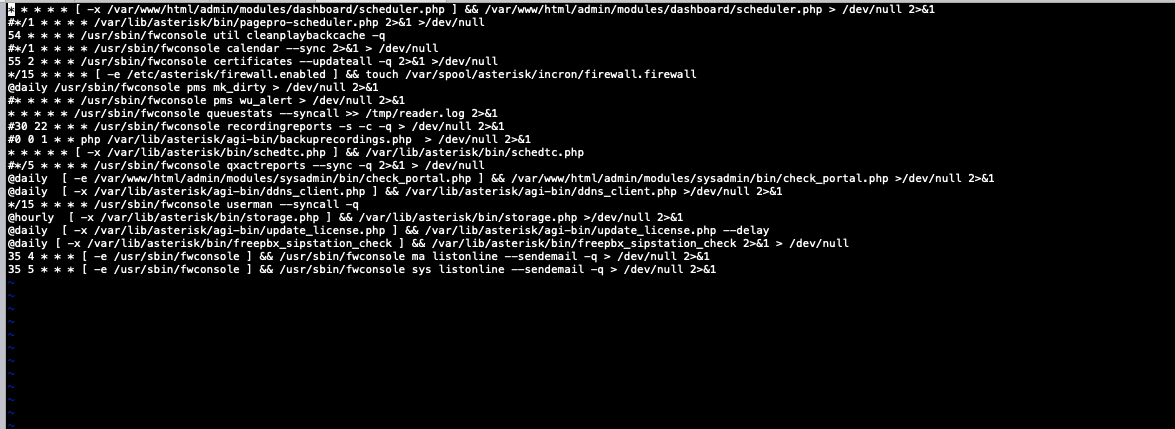
We host 35vm of FreePBX and got into a problem of Audio dropout with some VM, after investigation its look like its caused by the High CPU usage of these 2 cronjob:
* * * * * [ -x /var/www/html/admin/modules/dashboard/scheduler.php ] /var/www/html/admin/modules/dashboard/scheduler.php > /dev/null
and
* * * * * [ -x /var/lib/asterisk/bin/schedtc.php ] && /var/lib/asterisk/bin/schedtc.php

I found 2 thread about that similar issue without a real solution or a permanent fix.

Are you thinking this need a Bug report?

Thanks

Hello Fgunno,

This problem is still here.
I think it has something to to with encrypted php files with Zend and Commercial modules, because older PBX systems <= FreePBX 2.11 did not have this problem if they where not activated.

I know for sure, that all the default installed VPSs have this problem. High Cpu spikes on servers with more than 15 pcs FreePBX Distro VPSs. All at 60seconds (whole minute).

It is a bug, but only for hosting providers which Host multiple FreePBX VPSs

It has nothing to do with this. The files mentioned above are not commercial.

The issues you and the original poster are reporting have been resolved for a couple of weeks now. We’ve confirmed this on our own cloud system and from a few other OEMs.

Can you explain How its been resolved because I have 20 system that have the problem at this time…
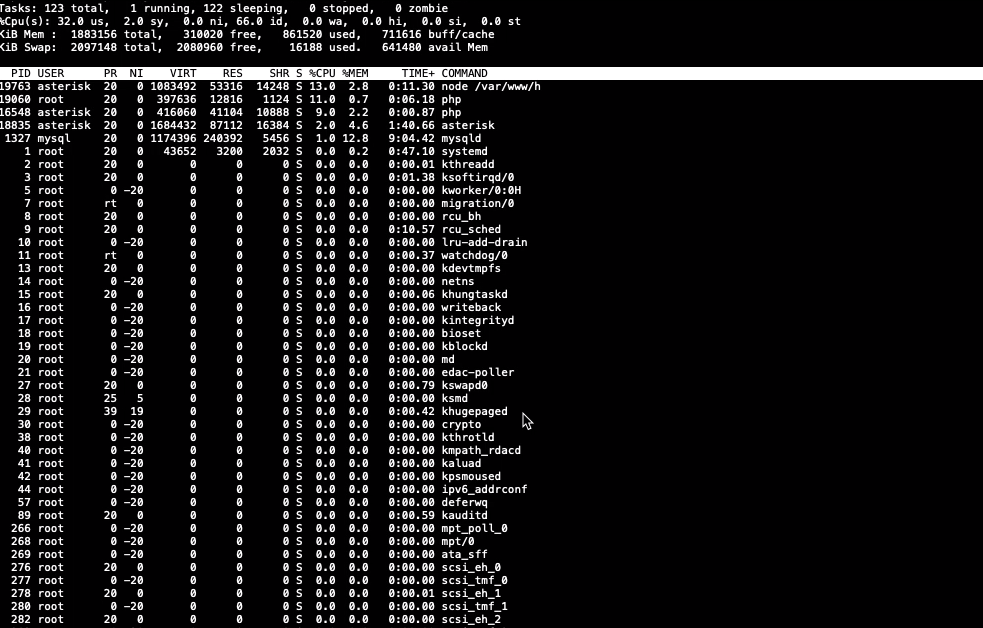
(All module enabled are updated) (I got between 60-90% CPU SPIKE sometimes)

I would also like to see where this is resolved and how.
We are still experiencing the same spikes as before.
Many thanks in advance

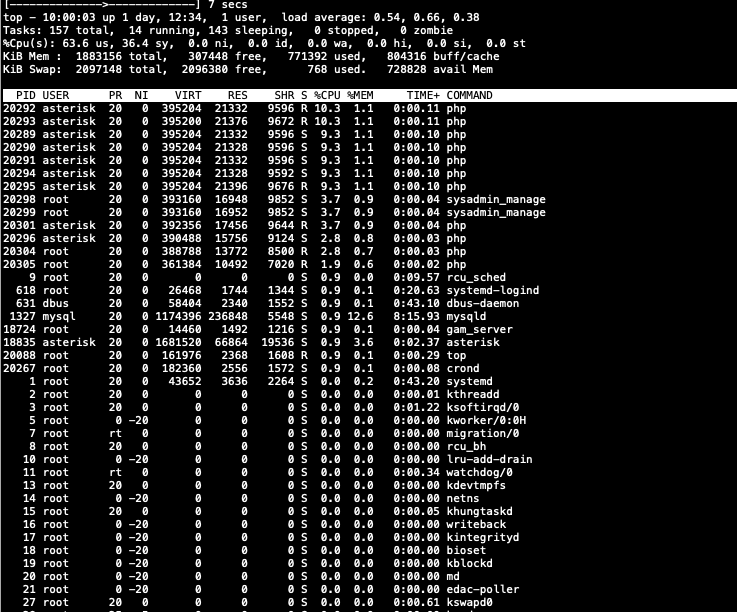
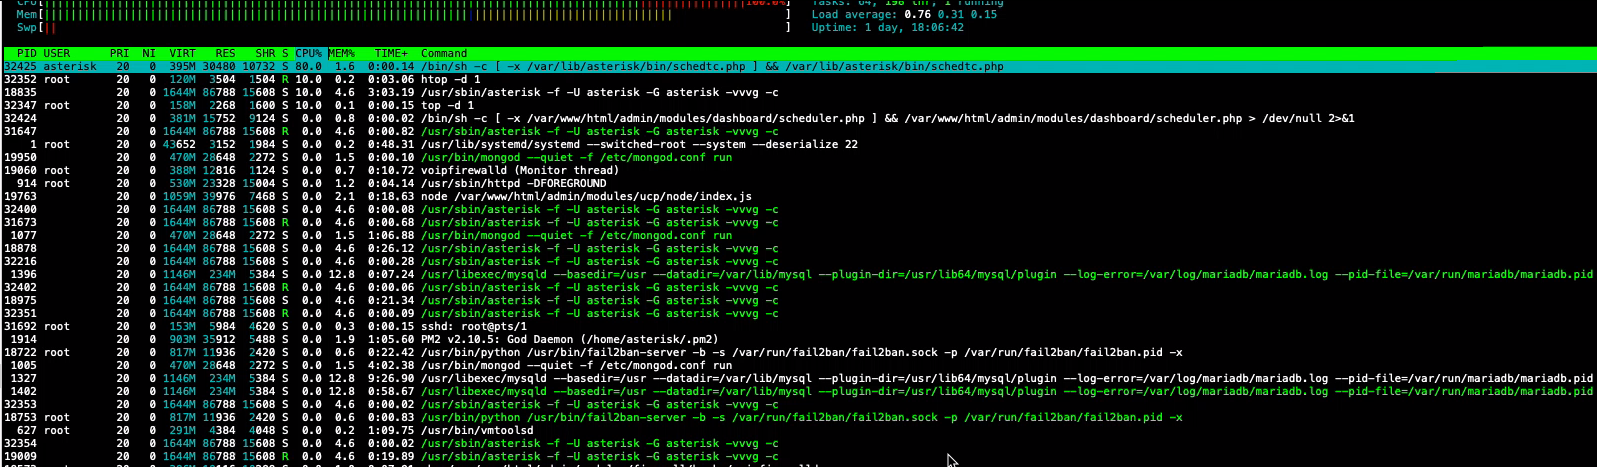
Your images show multiple PHP processes, unknown what any of them are doing because you didn’t provide enough information. We are talking about " scheduler.php". That is one PHP process.

also “sysadmin_manage” shows me that you are on FreePBX 13. So you’ve got performance issues from just being on such an old version of FreePBX.

I talk about the cronjob that made HIGH CPU every minutes.

This screenshot from another system ( PBX Version:14.0.5.25) show all the PHP process.


Crontab screenshot for more info…

You are showing me “php processes” no idea what they are actually calling. Now you are showing me three PHP processes when we are talking about one script. Each one is using 25% CPU. Since scheduler has a lock wait, three php processes can’t even happen at the same time from scheduler. Which is what you are blaming all of your problems on. In your first screenshot you have 11 PHP processes running. They are not all dashboard. Perhaps you should look and see WHAT the php process is doing or what php script is actually running before blindly placing blame on something randomly.

You can run ps aux | grep php to see what scripts are actually being run.

With the Original crontab

ps aux | grep php

asterisk 16548  0.0  2.1 416060 41104 ?        Ss   13:00   0:00 php /var/www/html/admin/modules/restapps/restapps.php                                                                                                                      
root     18573  0.0  1.0 395844 19116 ?        S    09:57   0:04 php /var/www/html/admin/modules/firewall/hooks/voipfirewalld                                                                                                                   
asterisk 20120  0.0  0.0 113172  1200 ?        Ss   13:15   0:00 /bin/sh -c /var/lib/asterisk/bin/pagepro-scheduler.php 2>&1 >/dev/null                                                                                                         
asterisk 20122  0.0  0.9 392356 17720 ?        R    13:15   0:00 php /usr/sbin/fwconsole qxactreports --sync -q                                                                                                                                 
asterisk 20123  0.0  0.9 392096 17532 ?        R    13:15   0:00 php /var/lib/asterisk/bin/pagepro-scheduler.php                                                                                                                                
asterisk 20124  0.0  0.9 392096 17456 ?        R    13:15   0:00 php /usr/sbin/fwconsole pms wu_alert                                                                                                                                           
asterisk 20126  0.0  0.9 392876 17984 ?        Rs   13:15   0:00 php /usr/sbin/fwconsole userman --syncall -q                                                                                                                                   
asterisk 20129  0.0  0.0 113172  1200 ?        Ss   13:15   0:00 /bin/sh -c [ -x /var/lib/asterisk/bin/schedtc.php ] && /var/lib/asterisk/bin/schedtc.php                                                                                       
asterisk 20130  0.0  0.0 113172  1200 ?        Ss   13:15   0:00 /bin/sh -c [ -x /var/www/html/admin/modules/dashboard/scheduler.php ] && /var/www/html/admin/modules/dashboard/scheduler.php > /dev/null 2>&1                                  
asterisk 20132  0.0  0.9 392356 17452 ?        R    13:15   0:00 php /usr/sbin/fwconsole calendar --sync                                                                                                                                        
asterisk 20133  0.0  0.9 392876 18248 ?        R    13:15   0:00 php /usr/sbin/fwconsole queuestats --syncall                                                                                                                                   
asterisk 20134  0.0  0.9 392096 17464 ?        R    13:15   0:00 php /var/lib/asterisk/bin/schedtc.php                                                                                                                                          
asterisk 20135  0.0  0.8 390488 15756 ?        S    13:15   0:00 php /var/www/html/admin/modules/dashboard/scheduler.php                                                                                                                        
root     20136  0.0  0.6 387864 11940 ?        R    13:15   0:00 /usr/bin/php /usr/bin/sysadmin_manager firewall.firewall                                                                                                                       
root     20137  0.0  0.6 387732 11940 ?        R    13:15   0:00 /usr/bin/php /usr/bin/sysadmin_manager firewall.firewall                                                                                                                       
root     20140  0.0  0.0 112704   972 pts/1    R+   13:15   0:00 grep --color=auto php    

Updated crontab


Peak are lower with some cron disabled:

If I disable all the 1 minute cron, NO PEAK…

So my conclusion is probably /var/www/html/admin/modules/dashboard/scheduler.php and /var/lib/asterisk/bin/schedtc.php are a big part of the problem, so its normal? Or its supposed to be fixed?

Your output shows 0% cpu for both schedtc.php and scheduler.php so no idea where you are coming up with that from.

asterisk 20129  0.0  0.0 113172  1200 ?        Ss   13:15   0:00 /bin/sh -c [ -x /var/lib/asterisk/bin/schedtc.php ] && /var/lib/asterisk/bin/schedtc.php                                                                                       
asterisk 20130  0.0  0.0 113172  1200 ?        Ss   13:15   0:00 /bin/sh -c [ -x /var/www/html/admin/modules/dashboard/scheduler.php ] && /var/www/html/admin/modules/dashboard/scheduler.php > /dev/null 2>&1

Because when it’s disabled we have NO PEAK…

The 2 PHP file probably call some other function on the system that cause the peak? No?

What’s your guess?

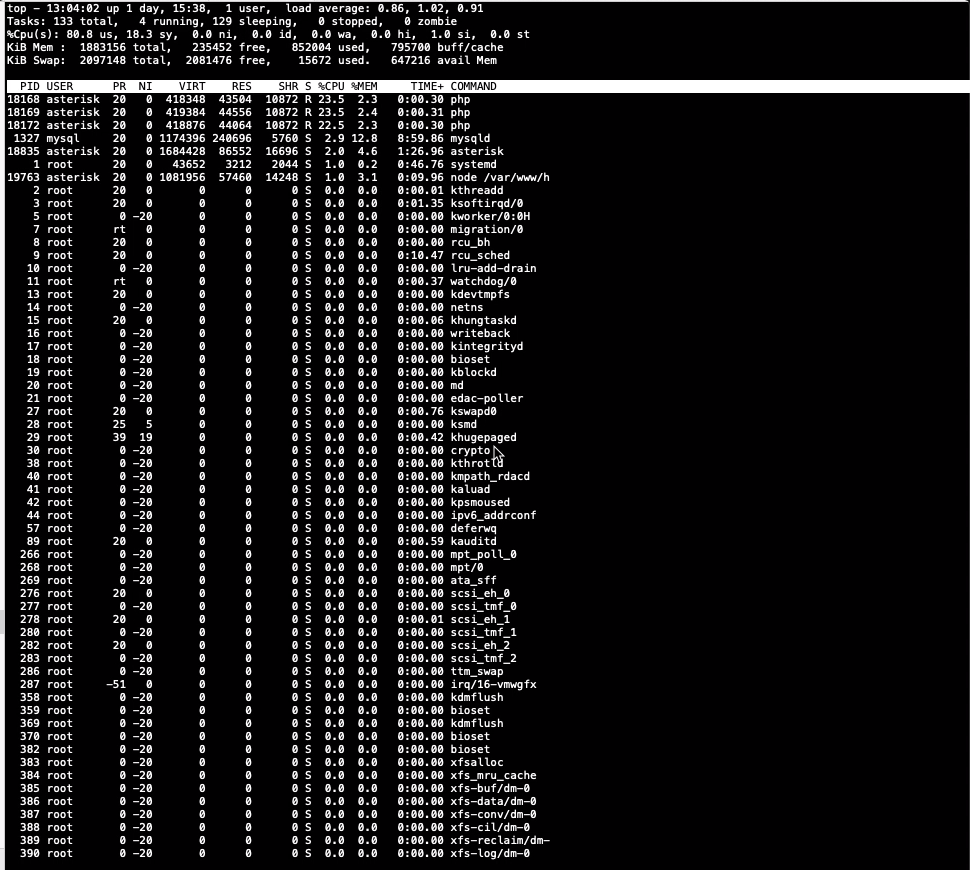
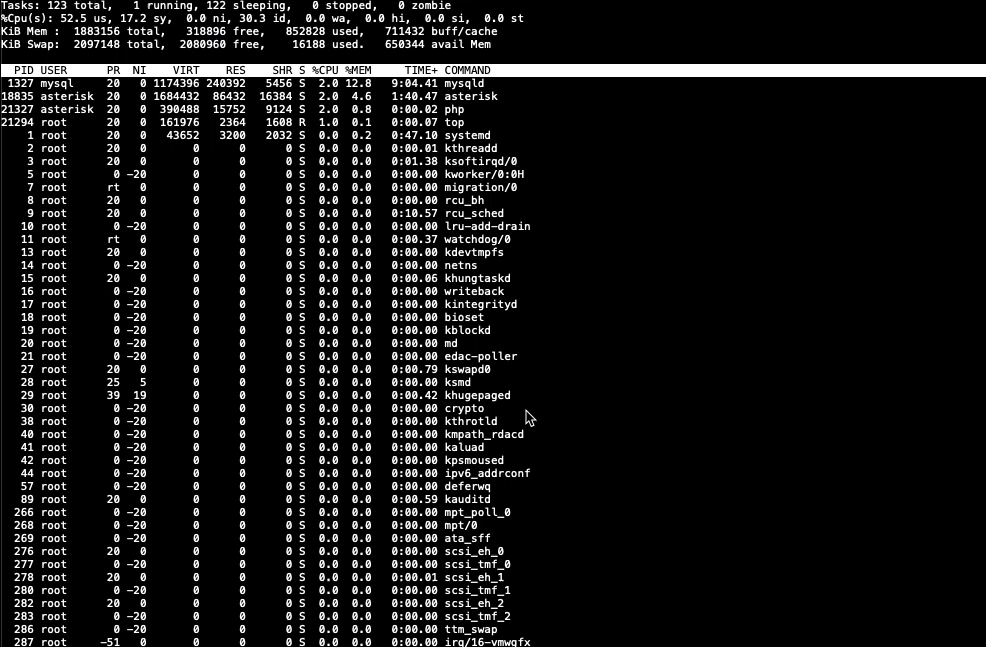
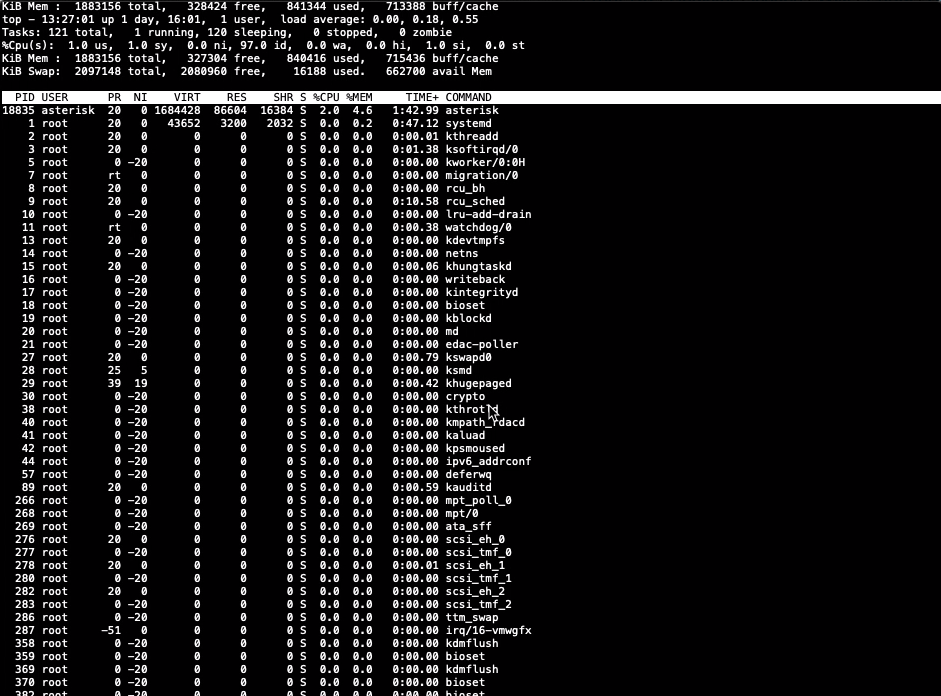
No. You are monitoring these two scripts, they are both 0% CPU but you say they are both causing 60% CPU. None of your data lines up. Look at the other processes that are actually using CPU. (which in your aux are none of them). You basically just choose the two processes that run every minute without digging into them further, schedtc.php does nothing, scheduler.php performance was improved in dashboard 14.0.6.1.

In fact your data shows that all processes are using 0.0% CPU. My guess would be use the commands I provided to you and when you have high CPU run them to figure out what processes are using that CPU.

You also commented out calendar. All calendar does is connect to the internet and download ical files. It does no further processing. Are you fully updated on these machines?

Ok… maybe the Screenshot is not good for this problem.
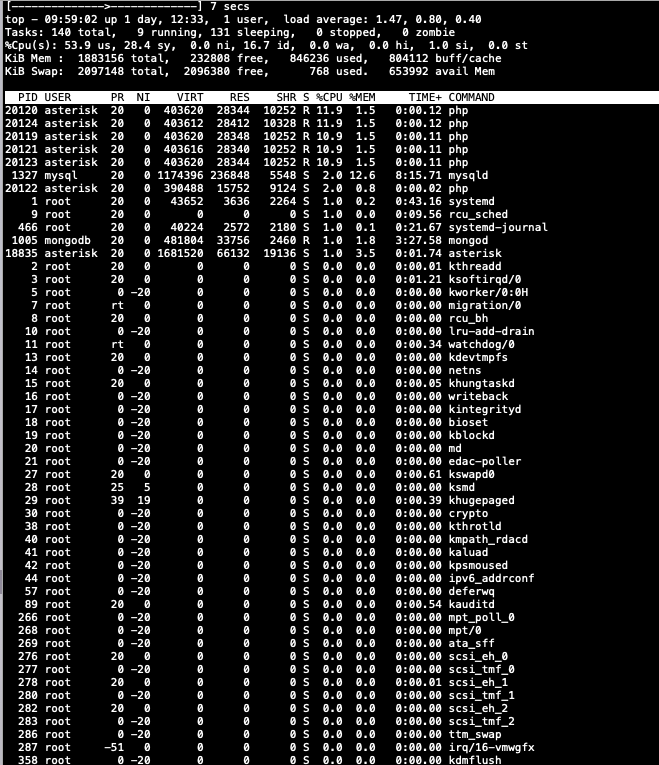
Check these 2 videos I made on a test PBX I have, some module is already disabled so the peak is not as high of orignal install…

Default Settings in crontab
Crontab disabled

We can see that PHP used 10% cpu for 1 instance and some other used a little bit and mysql used some too…
So I am wrong if I say something in the cronjob is causing the High CPU peak?

I can’t tell what php processes are using cpu. I can’t even say it’s the cron jobs. You keep using top so it’s impossible to tell what is doing what. Try using htop or something that can tell you what the php processes are doing.

What schedtc.php do exactly ?

It sets BLFs for time conditions you can disable it in advanced settings.

If I disable the Time condition stop working right?

No. This is for blf lights only

I have noticed, if I install >15pcs VPS FreePBX systems on one host, the get a problem with CPU spike on the whole minute.
This is with Default settings in FreePBX 13 and 14.
This is a simple fact. (bug or problem in default Distro versions)

If it is fixed in v14, what is the fix?

We can diagnose the whole day for different configs, but it is a fact that there is a problem in the default configs.

I don’t want to be negative, but it feels like the problem is not discussed, nor acknowledged by Sangoma. Just how to diagnose your cron jobs, does not help much.

What is changed in V14 that solves this problem?

Many thanks for you effort.

We have to come to some sort of issue for the team to be able to diagnose. If you think that doesn’t help much then I’m at a complete loss as to how to help you. I work for Sangoma. Sangoma is right here in this thread trying to get to the bottom of it by asking for detailed information about what processes have issues to then just get dismissed with “does not help much”. Sangoma employees do not have to participate in these forums at all.

Don’t know what you expect. Remember that we also run a hosting service so it would be against our better interests to document and detail everything we do in our own cloud environments. If we did that anyone could just copy what we do and Sangoma would cease to exist and so would freepbx development.