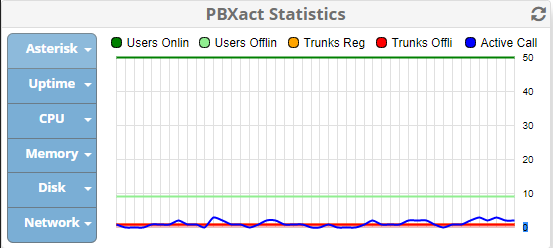
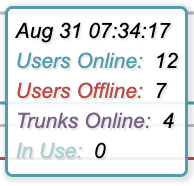
PBXAct Statistics shows the following infos.
I would like to change this as the scale is a bit too rough. Users Online are 50 but the rest is lower than 10 and I cannot see exactly whats their value.
Is there any chance to adjust this view?
PBXAct Statistics shows the following infos.
I would like to change this as the scale is a bit too rough. Users Online are 50 but the rest is lower than 10 and I cannot see exactly whats their value.
Is there any chance to adjust this view?
If you hover over the data it will show you the data points for each line. The minimum refresh period is 50 seconds, so as you slide down, the data points box will show the data for each capture. You can modify the refresh time settings in the advanced settings module.
If there isn’t one already you could look into opening a feature request to enable options to select which data points you want to view in this widget, but there are probably better alternatives, such as using Grafana. Or InfluxDB/ Grafana, you just want to be careful how much of a load you add to a system with additional logging/reporting and communications with other systems, it can potentially have impacts on voice quality if you go too far.
@lgaetz has a related post here Monitoring FreePBX system with Grafana Cloud
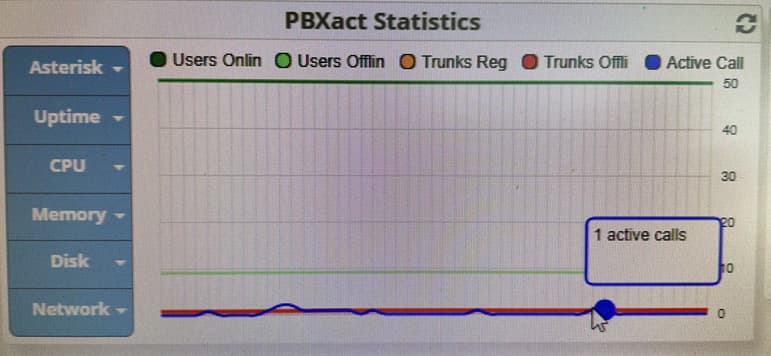
When I hover over the data I can only see the data for one single capture and as long as everything is <5 I can see nearly nothing because the value for Users Online is quite high (50):
so “active Calls”, “Trunks offline” and “trunks reg” are nearly all the same flat line.
This topic was automatically closed 31 days after the last reply. New replies are no longer allowed.