The announcement that Grafana Cloud had preconfigured templates for Asterisk made the rounds on social media earlier this week, linking to this blog:
With interest piqued for a new #FridayFun project, I went about setting it up. It doesn’t take much effort to get a stock SNG7 distro up and running. Here’s what I did:
You’ll want to start with a FreePBX Distro install running asterisk version 18+. You can upgrade asterisk using this method if you’re still on 16 or an older unsupported version. Obviously this should all work with a non-distro install, but may require slight modifications in the setup.
First bring the fire by creating the file /etc/asterisk/prometheus.conf with this content:
[general]
enabled = yes
core_metrics_enabled = yes
uri = metrics
Ensure file is owned by asterisk:asterisk (or just run fwconsole chown) then restart Asterisk. Ensure it’s working from the Asterisk console with :
*CLI> prometheus show status
Prometheus Metrics Status:
        Enabled: Yes
        URI: metrics
        Basic Auth: No
        Last Scrape Time: 2022-05-06 06:58:53
        Last Scrape Duration: 0 ms
and from the bash prompt:
# curl http://127.0.0.1:8088/metrics

# HELP asterisk_channels_count Current channel count.
# TYPE asterisk_channels_count gauge
asterisk_channels_count{eid="56:00:03:7e:38:33"} 1
   *snip*
With that done, login to Grafana Cloud and click the lightning bolt “Integrations and Connections” icon. Select Asterisk from the list and click the upper right button to ‘Install Integration’. With that in place you can select the OS and Arch for your PBX (Redhat-AMD64 for SNG7):
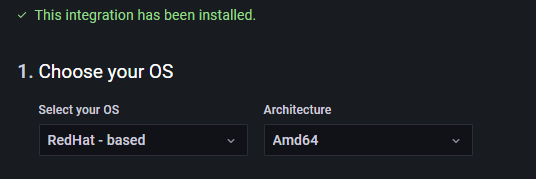
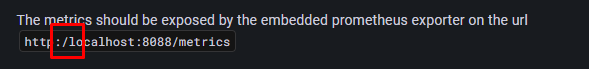
And near the bottom of the page, you’re provided with a long command to install the Grafana agent on the PBX. Paste that to the command line. Note that on this page of instructions, there is a typo in the test URL which I need to figure out how to report:
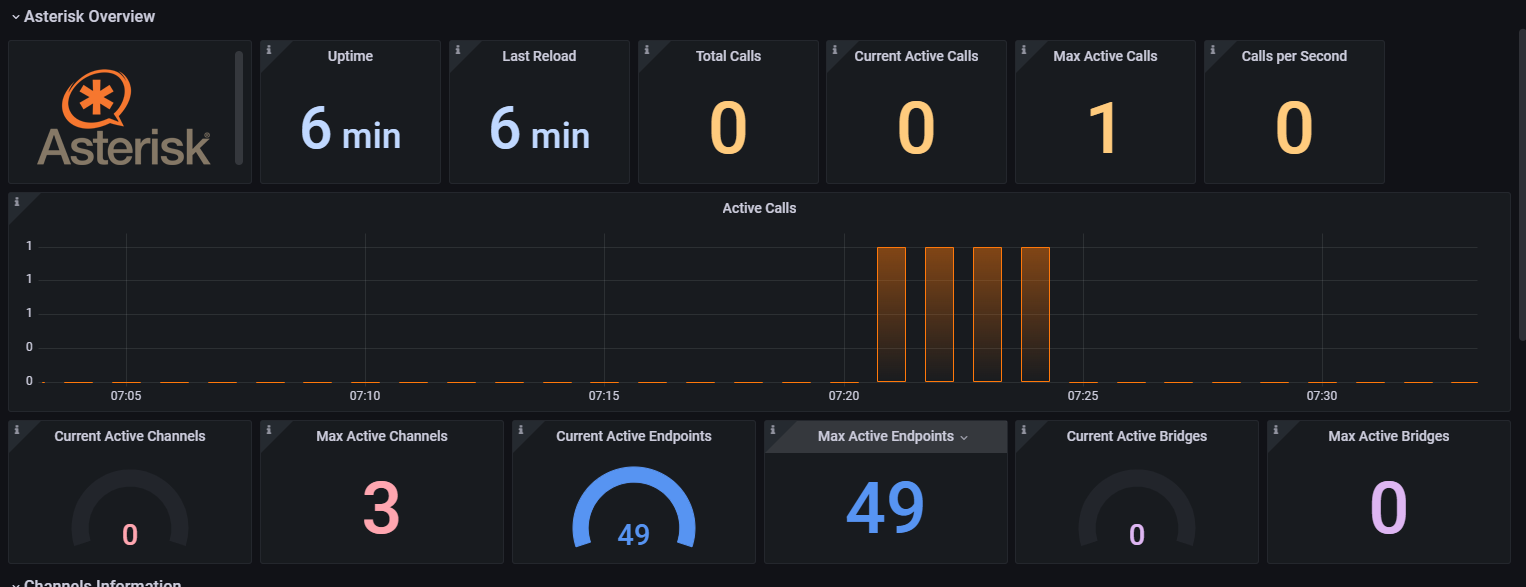
And that’s it, once the agent is running, Asterisk stats are fed continuously to the new Dashboard in Grafana Cloud. You can access it by clicking Dashboards - Browse, they appear under the “Integration - Asterisk” section, one for logs and one for system stats.
I’m new to Grafana Cloud and tho I’ve touched grafana systems, I’ve never set up dashboards before. At this point there are a few things that I’m not sure about:
- Grafana Cloud has a free tier, but I’m currently working thru my free pro into period. I’m not sure what effect, if any, moving down to the free tier will have on the Asterisk Dashboard
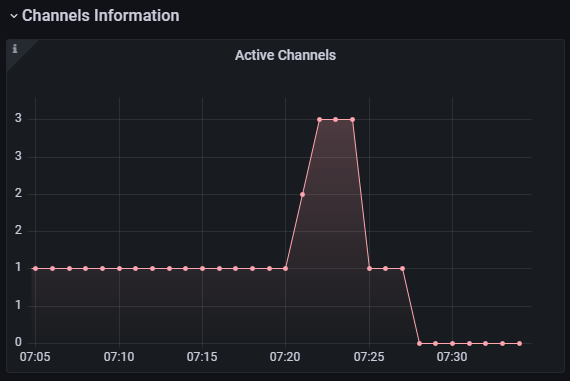
- The Overview dashboard shows things like an active call and channel counts, but it can lag the actual event by a bit. It looks like there are options for adjusting the scrape interval for the grafana agent as well as the refresh interval for the dashboard, but I’ve not had a chance to play with them.
- Some of the dashboard template widgets are not all that useful. You get a live count of active endpoints which is essentially static, but not active registrations which would be useful. It displays info for call bridges and channels, but no caller/callee info. This may be a limitation of the Prometheus data, I haven’t investigated further.