I’d like to introduce you to Obelisk, a queue and agent management software with interesting features.
It was designed for immediacy and speed. Just copy the files to a folder, such as /var/www/html/obelisk, on your PBX and enter the configuration parameters. That’s all.
There will be two versions: a free one with limited functionality and one with full and advanced features.
Coming Soon
A. Real-Time Dashboard & Wallboard
The core of Obelisk is its ability to visualize queue status instantly via the Asterisk Manager Interface (AMI).
Dual Views:
Dashboard View: Detailed cards for every queue with expandable statistics, charts, and agent lists.
Wallboard View: A high-contrast, streamlined view optimized for large TV screens in call centers.
Live Metrics: Displays waiting calls, abandoned calls, SLA (Service Level Agreement), Answered/Completed calls, Hold time, and Talk time.
Algorithmic Health Score: Calculates a dynamic “Health Score” (0-100%) for each queue based on wait times, available agents, and SLA, displayed as a traffic-light color code.
Visual Alerts: Blinking thresholds for calls waiting and excessive idle times.
Agent Management:
Global Toggle & Sorting: Sort agents by Status or Name.
Real-time statistics: Total, Free, Paused, DND, Busy, and Talking agents.
Multi-Status Badges: Visual indicators for Pause, DND (Do Not Disturb), Ringing, Talking, and Unavailable.
Control Actions: Supervisors can force Pause/Unpause, Log Out agents, or initiate Live Monitoring directly from the interface. (Spy,. Whisper and Barge)
Dynamic Charts: Real-time Pie charts showing Waiting vs Ringing vs Talking.
Agent Info: Rich tooltips with Last Login, Last Call time, Call Count, Pause Duration/Reason.
Agent Watchdog: Idle time monitoring with configurable threshold alerts for inactive agents.
Global View Filters: “Free & Talking” toggle available on both Dashboard and Wallboard views.
B. Live Supervisor Monitoring (Spy/Whisper/Barge)
Obelisk allows supervisors to intervene in live calls seamlessly:
Listen (Spy): Silent monitoring; neither the agent nor the customer can hear the supervisor.
Whisper (Coach): The supervisor speaks only to the agent (coaching) without the customer hearing.
Barge (Conference): A three-way conference where everyone can hear and speak.
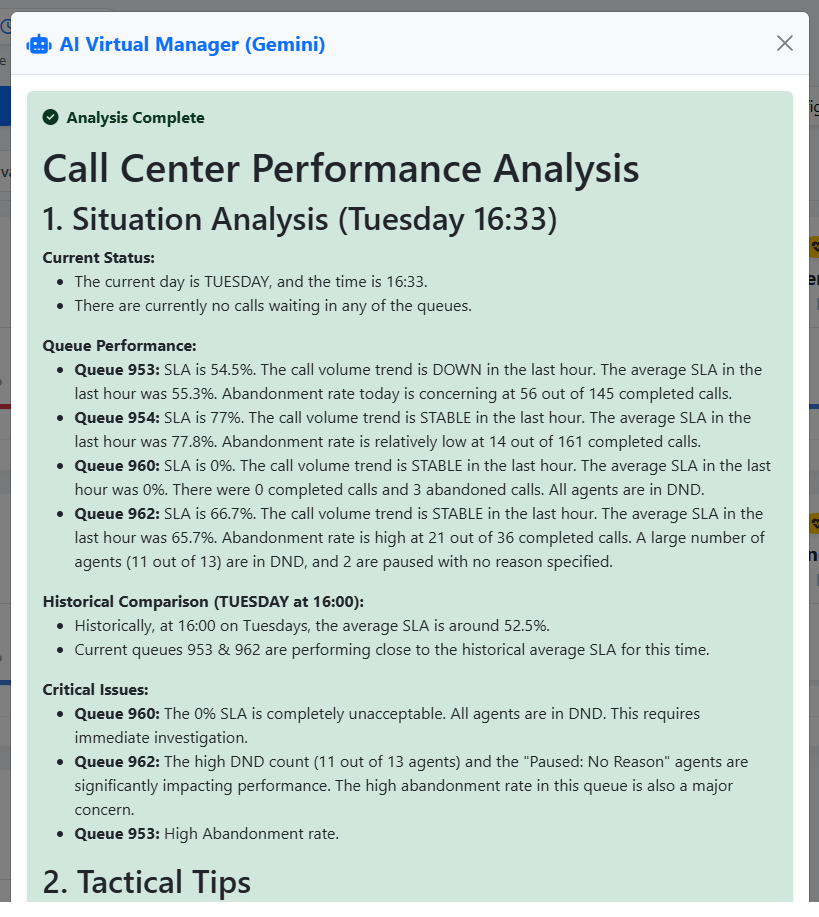
C. AI Virtual Manager (Gemini Integration)
Obelisk includes a cutting-edge “Virtual Manager” powered by Google Gemini 2.0 Flash.
Strategic Advice: The AI analyzes live queue data + historical trends to generate tactical advice (e.g., “Shift staff to Sales queue,” “SLA is dropping”).
Smart Throttling: Built-in rate limiting (1 request/60s) prevents API quota abuse while ensuring fresh data.
Context Awareness: The AI is fed real-time data, 1-hour trends, and historical staffing heatmaps to make informed decisions.
D. Quality Assurance & Recording Manager
Recordings Manager: Full interface to browse, filter (Year/Month/Day/Category/Keywordds), and play audio recordings.
Audio Robot (Background Processing): A CLI script (cron_audio_analyzer.php) runs in the background to scan, transcribe, and analyze recordings automatically.
AI Analysis:
Sentiment: Categorizes calls as Positive, Neutral, or Negative.
Resolution: Detects if the issue was Resolved, Unresolved, or requires Escalation.
Advanced Player: Includes a waveform visualization (WaveSurfer.js) and precise duration calculation based on WAV header parsing.
Chat-Style Transcripts: Displays call transcriptions in a readable, chat-like format separating Agent and Customer.
Quality Dashboard: Visual charts in Forecast module for Sentiment, Resolution, Call Reasons, and Word Cloud.
AI Word Cloud: Visual representation of most frequent topics/keywords in calls.
CSV Export: Full data export of recordings including AI metadata and transcriptions.
E. Analytics & Forecasting
Predictive tools to help managers plan ahead.
Traffic Forecast: Uses linear regression to predict traffic volume for the next 15 minutes.
Staffing Heatmap: A visual matrix showing historical call load by Day of Week and Hour (08:00 - 20:00).
SLA Analysis: Break down of Service Level based on Queue Weight/Priority (Premium vs. Standard).
F. Extension Diagnostics (PJSIP)
A diagnostic tool for IT staff to monitor the health of SIP extensions.
Latency Monitoring: Displays Round-Trip Time (RTT/Ping) with color-coded alerts for high latency (>100ms warning, >400ms critical).
Device Info: Shows User Agent (Brand/Model), Firmware version, and registered IP addresses.
1. Technical Architecture & Performance
Obelisk is engineered for speed and scalability, solving common issues found in Asterisk dashboards (like the “Thundering Herd” problem).
Server-Side Micro-Caching: Reduces load on the Asterisk server by ~90%. It caches AMI responses for 2 seconds using file-based locking.
Non-Blocking Locks (Flock): Prevents server overload when multiple users access the dashboard simultaneously.
Thundering Herd Protection: Non-blocking file locks prevent server overload during concurrent access.
Frontend Hash Check: The JavaScript client checks data hashes before modifying the DOM, eliminating screen flickering and reducing CPU usage on the client side.
Database: Uses SQLite with WAL (Write-Ahead Logging) mode enabled for high-concurrency read/write operations.
obelisk_history.db: Stores traffic metrics.
obelisk_recordings.db: Stores AI analysis and metadata.
Background Processing: Heavy tasks (logging history, analyzing audio) are offloaded to CRON scripts to keep the web interface responsive.
Page Visibility Auto-Pause: Stops refresh when tab is hidden to save resources.
Live Clock & Auto Refresh System: Includes Lock/Pause toggle for manual inspection.
Robust PJSIP/Local Interface Parsing: Fixes for FreePBX/Asterisk complex strings.
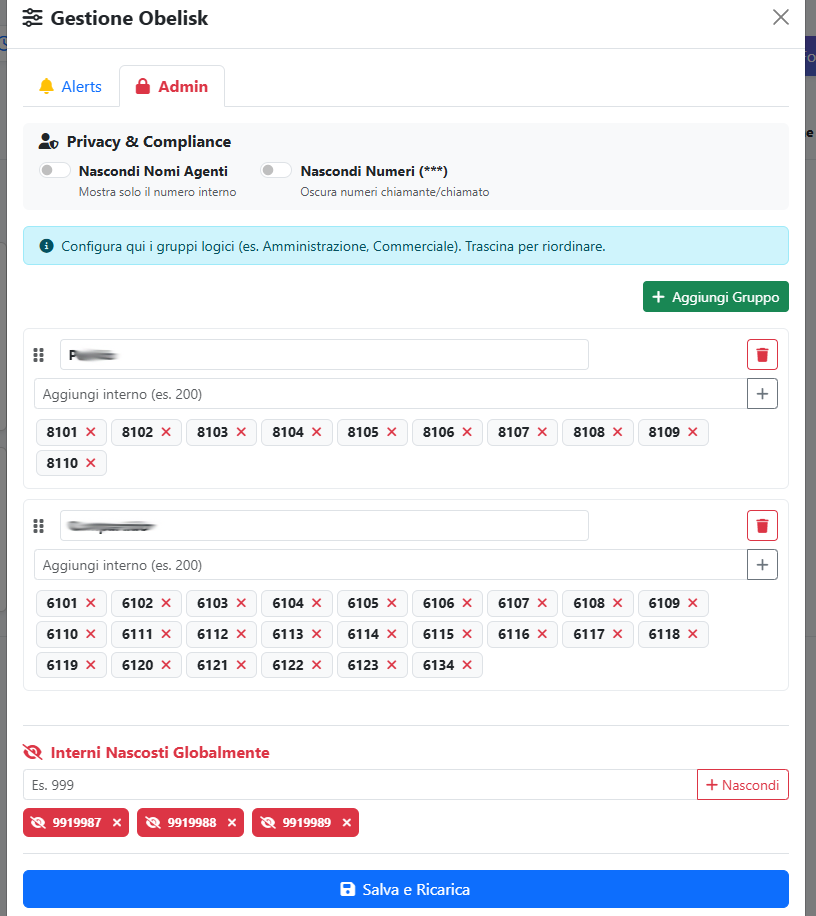
2. Customization & Administration
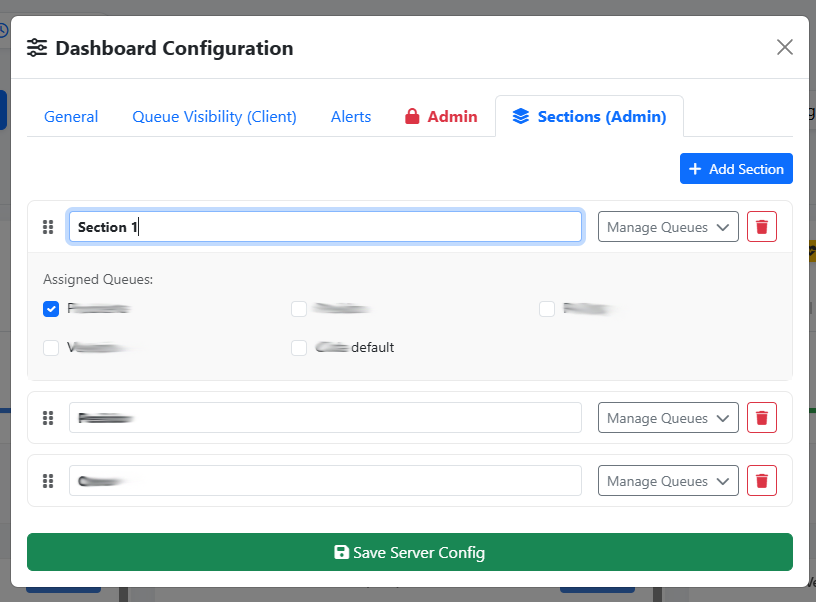
Custom Sections: Administrators can group queues into logical tabs (e.g., “Support”, “Sales”, “VIP”) via Drag & Drop.
Section Management: Create, Rename, Sort, and Delete sections/tabs.
Visibility Management: Hide specific queues globally or per section.
Drag & Drop: Reorder Queues and Sections via UI (Dashboard & Wallboard).
Privacy Modes:
Agent Privacy: Hides real names, showing IDs instead.
Caller Privacy: Masks phone numbers for GDPR compliance.
Multi-Language: Built-in support for Italian, English, and Spanish, with auto-detection based on browser settings.
Configuration: All settings are stored in a portable JSON file (obelisk_config.json).
Thanks for the introduction, Obelisk looks very promising, especially the lightweight deployment and real-time approach.
I’m interested in learning more about it.
Do you have additional details about the planned features for both the free and full versions?
Also, is there an estimated release date or roadmap available yet?
Thank you for your interest. We’re finishing the website and expect to have it live by the end of the year or the first few weeks of January. I’m currently making some changes in production, testing it on a production environment with about 200 operators, 10 queues, and about 2,000 calls per day.
I tried to stick to a simple approach: copy the files to the server, set the parameters for the Asterisk manager (username and password), and you’re done. Using the AI is also free and optional; you can use your own Gemini API key, and given the way the software is designed, even with 900 registrations per day and querying the AI for information on contact center performance, the cost is practically zero, as it stays under Google’s free quota. Of course, you can also opt for a paid version and have no limits.
Thank you for the update, that sounds great!
It’s impressive that you’re already testing it in a live production environment with so many operators and queues. The simplified deployment model is exactly what many people are looking for, and the optional AI integration with almost zero cost is a very smart approach.
I’m really looking forward to seeing the website go live and to learning more about the full feature set once everything is ready.
The first screenshot looks promising as well!
Please keep me updated, I’d be very happy to test Obelisk as soon as it becomes available.
We’ve put the website online. It’s still under construction, so please be patient.
At the moment only the Lite version is available for free download, we will gradually publish the various guides and other information for the full version
OBeliSK
We stripped away the noise to leave you with the absolute essentials: blazing speed and uncompromising data. It’s not just a name, it’s our philosophy:
The full version does all this and more, such as showing agents on pause, in DND, and in conversation. There’s also an additional section I completed recently that shows the activity of each extension, including for outgoing calls, identifying whether the person is using a SIP phone, Sangoma Talk, or Sangoma Desktop. There are so many features; I’m finishing testing it in a second Spanish-language call center; the initial test was in Italian. Unfortunately, there’s a lot to write in terms of documentation, if you’ve seen the list of features.
I’d like to publish the additional pages on the site with all the screenshots and a comprehensive guide, because sometimes a picture says more than 1,000 words.
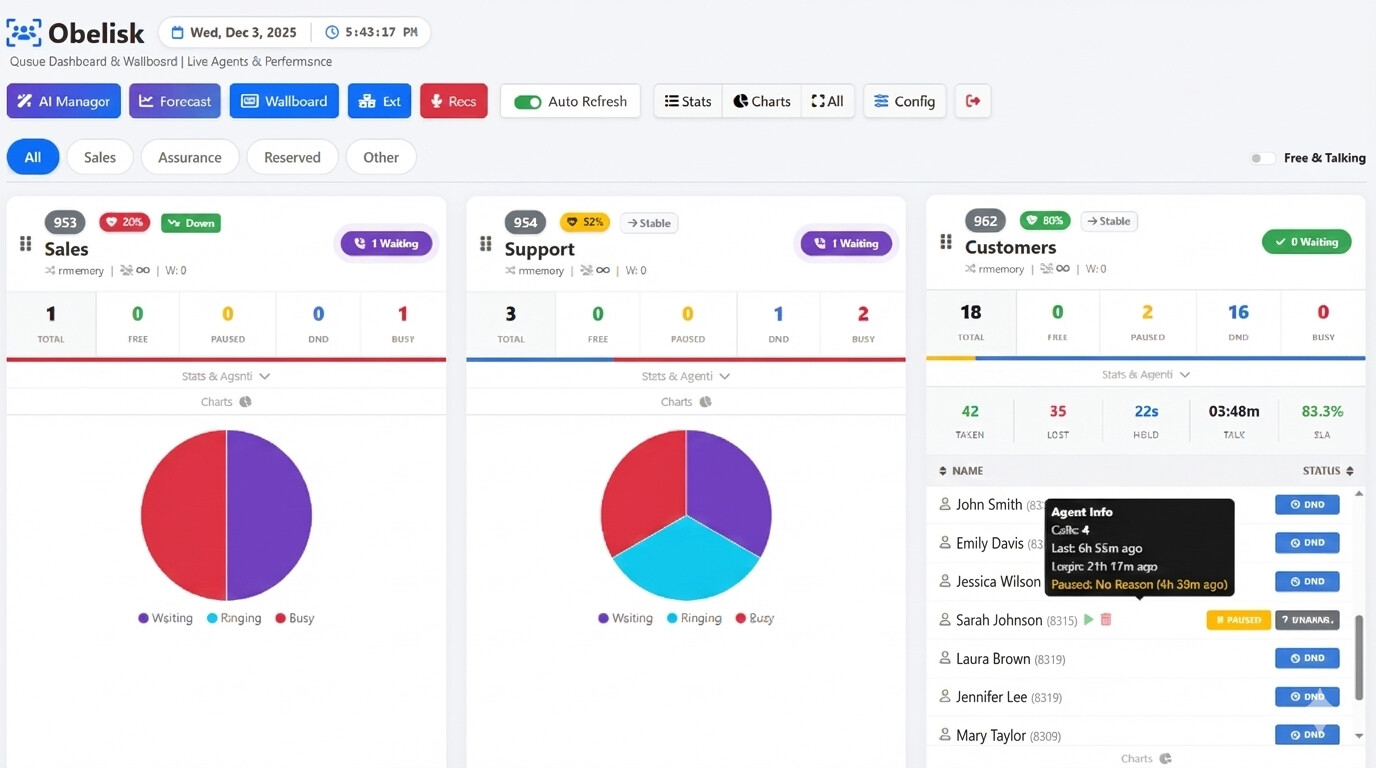
In this dashboard, the names of queues and operators are obscured for privacy. There are boxes, each dedicated to a queue, displaying the following information:
The name of the queue and its contents
The health score function, which gives a score to the queue’s status (the pill with the heart icon that changes color between yellow, red, and green, with a relative % value)
The queue’s performance based on statistics from the last hour. In the screen, the gray pill-shaped icon “Stable” indicates that the number of calls has remained stable over the last hour. This case also changes color depending on events.
For each queue, the ringing strategy (e.g., rrmemory) is shown, as are the number of callers it can accept (the infinity symbol appears on the screen when there are no limits), and the queue weight (W).
The green pill (Waiting) shows the number of callers waiting, which turns purple and flashes when there is more than one caller.
Qualitative and quantitative information on the queue status is shown, i.e., the number of agents: those free, those on pause, those on hold, and those busy.
Statistics for each queue are shown, including the number of calls taken, calls lost, average waiting time, average conversation time, and the % of SLA.
Below are the names of the operators and their status (on the phone, DND, on hold, unavailable, etc.), and even below that is a pie chart with dynamic colors that indicates whether there are customers waiting, operators whose phones are ringing, or those busy.
a dynamic bar just below the queue composition that changes color based on how many agents are free, busy, in dnd…for a quick check
For each agent, a tooltip is displayed with information such as the number of calls, the last call, and the last login, as well as the status (Available, DND, Busy, Unavailable, or on Pause).
The orange hourglass icon is the WatchDog, a configurable value that creates a flashing icon if, for example, the agent has been free for too long or has been ringing unanswered for too long (the values in seconds can be modified from the admin panel).
An agent can be paused, forcibly paused from the page, or removed from pause. Obelisk also displays the reason for the pause and whether the pause was forced by an admin, as well as the pause duration.
Furthermore, if there are multiple states for an agent (for example, DND and Pause) both are displayed. The green icon allows you to delete the pause, while the trash can icon removes the agent from the queue. ALL these operations are recorded in the queue_log in case they need to be retrieved for statistical purposes.
Here’s another screenshot showing the purple pill with two customers in the queue and the graph updating. As you can see, there’s a nearly entirely blue bar and a red section at the end showing the qualitative composition of the queue (23 operators, 22 of which are in DND (blue) and 1 busy (red).
Next to the operator’s name, there’s a trash can to remove them from the queue and a pause icon to force a pause.
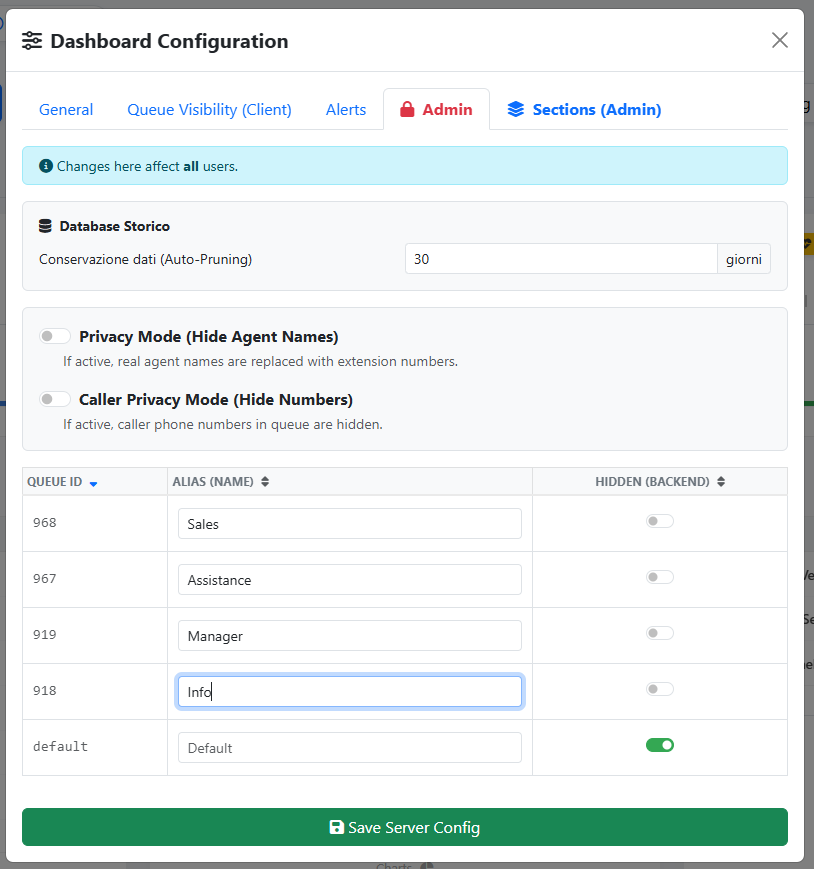
You can move queue cards with a simple drag & drop, as well as organize them into sections (for example, on the main screen, there are four sections: All for all queues, and three more that can be renamed as desired). The administrative panel allows for some configurations, such as
watchdog to set limits in seconds and have alerts appear as flashing icons, or to assign queues to each section with a custom name, to hide queues you don’t want to be visible, or to activate privacy mode to hide operator names and customer phone numbers, or even manage data retention.
The wallboard focuses on queued agents. It features the same information as the dashboard, but at a glance, you can see which agent is in the queue and what they’re doing, whether there are calls waiting (and whether these have a priority), and how long they’ve been in the queue. Whether the agent is busy, free, on hold, on pause, or unavailable.
Again, hovering over each agent provides quick statistical information, such as the total number of calls taken, when they answered the last call, how long they’ve been logged in, how long they’ve been on pause, and why. From this panel, you can also add or remove agents from the queue, as well as delete an agent from the queue
section displays not only queued agents but all PJSIP extensions, so agents making outbound calls can be monitored in the same way. It shows who they’re talking to, if it’s an outbound call, which trunk they’re using, and which phone (e.g., Sangma Desktop, Sangma Mobile, Webrt via UCP, or another PJSIP phone). It’s also possible to listen to agents (Listen, Whisper, or Barge), view their status, set filters (only agents online and in conversation, or hide those offline), organize them into sections (groups), and manage administrative options to hide and organize critical or service extensions. There are also various privacy options.
Here too it is possible to have a watchdog threshold, for example if an agent’s phone rings for more than x seconds or talks to a customer for more than X seconds