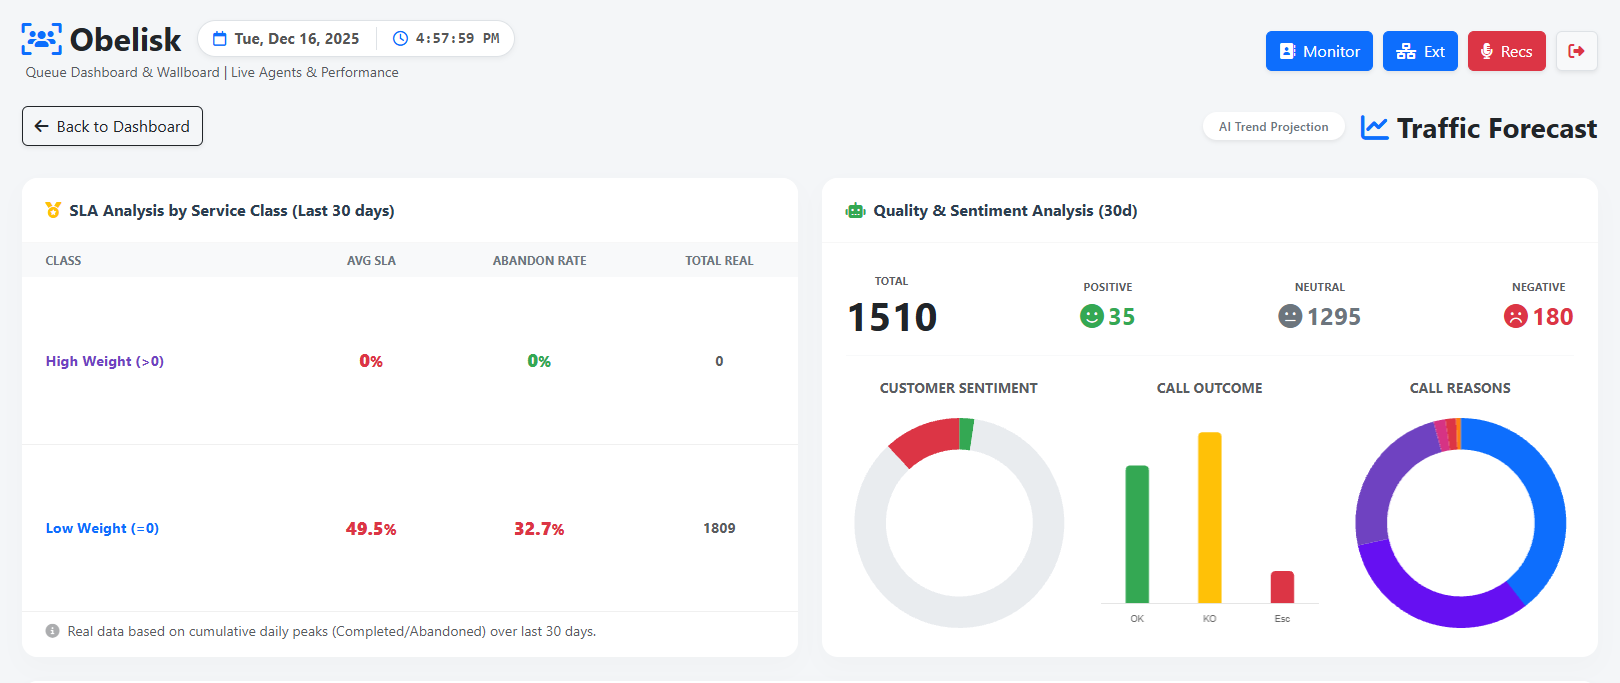
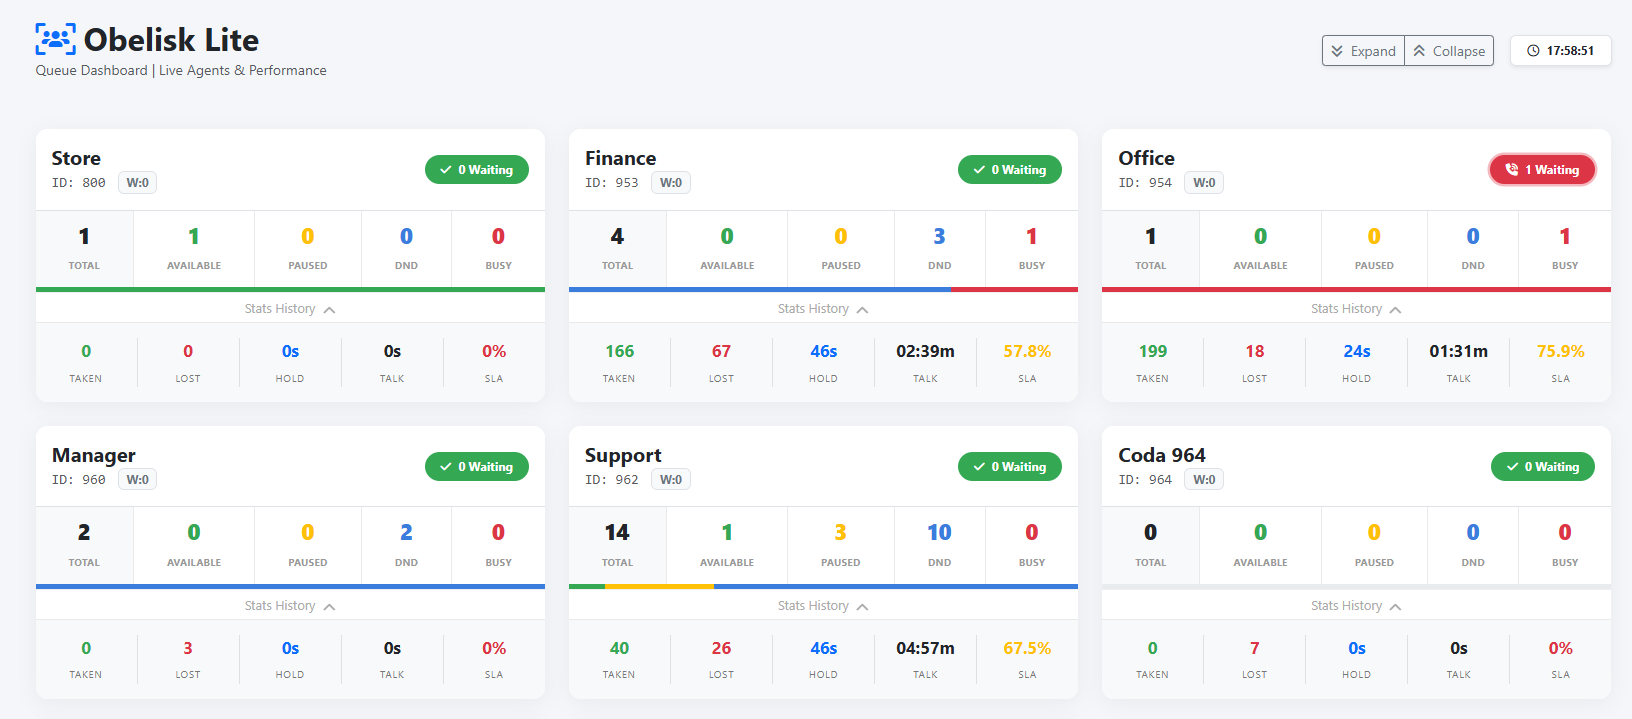
section displays various information. Using queue weighting will help you understand whether the strategy is working.
There’s a section that summarizes the AI data, including call sentiment, type, score, and much more. There’s also a section for the most frequently spoken words on the phone, whose size and thickness depends on the number of times they’re repeated.
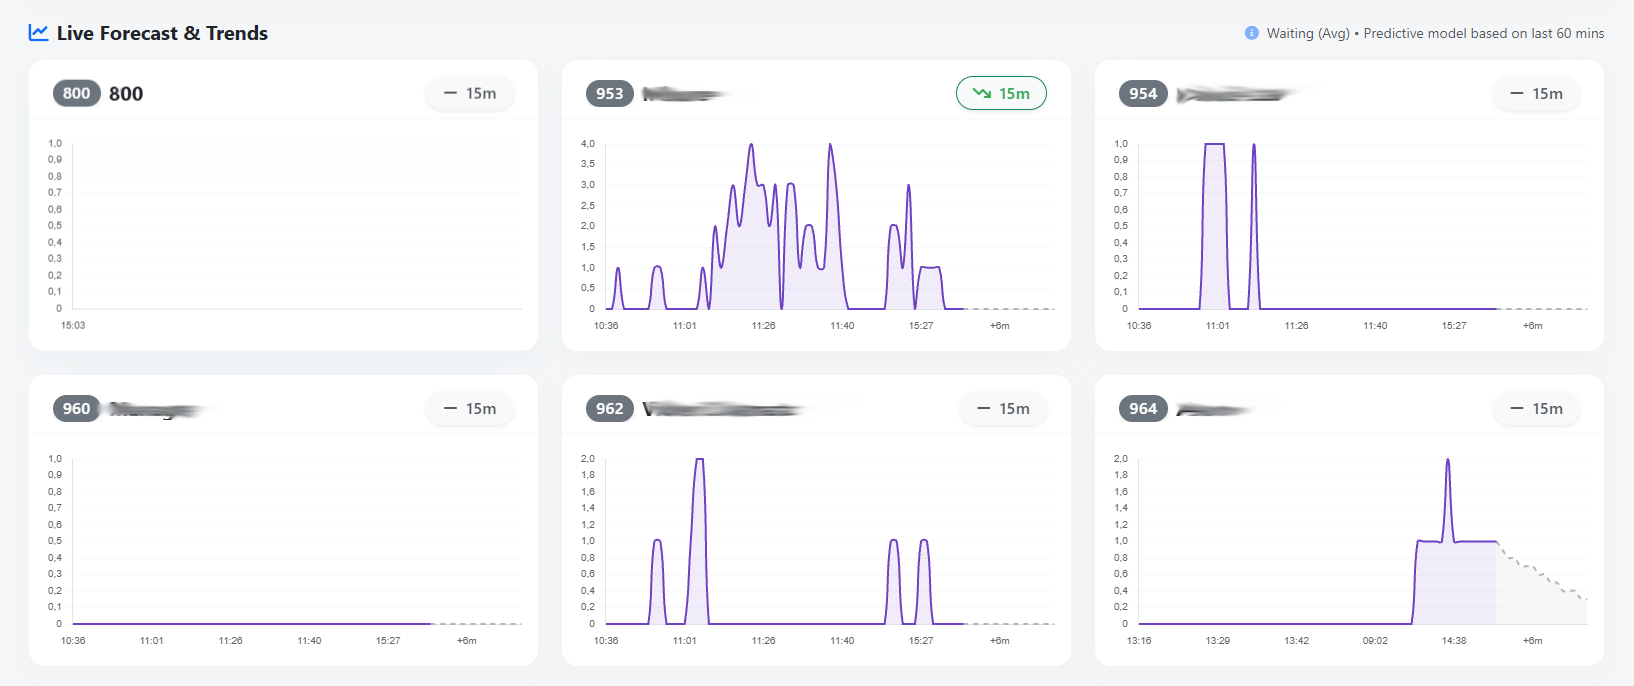
A linear regression algorithm estimates call trends over the next 15 minutes for each queue, allowing a Team Leader to make real-time decisions about moving agents from one queue to another.
For each queue, a graph and pill icons show call trends.
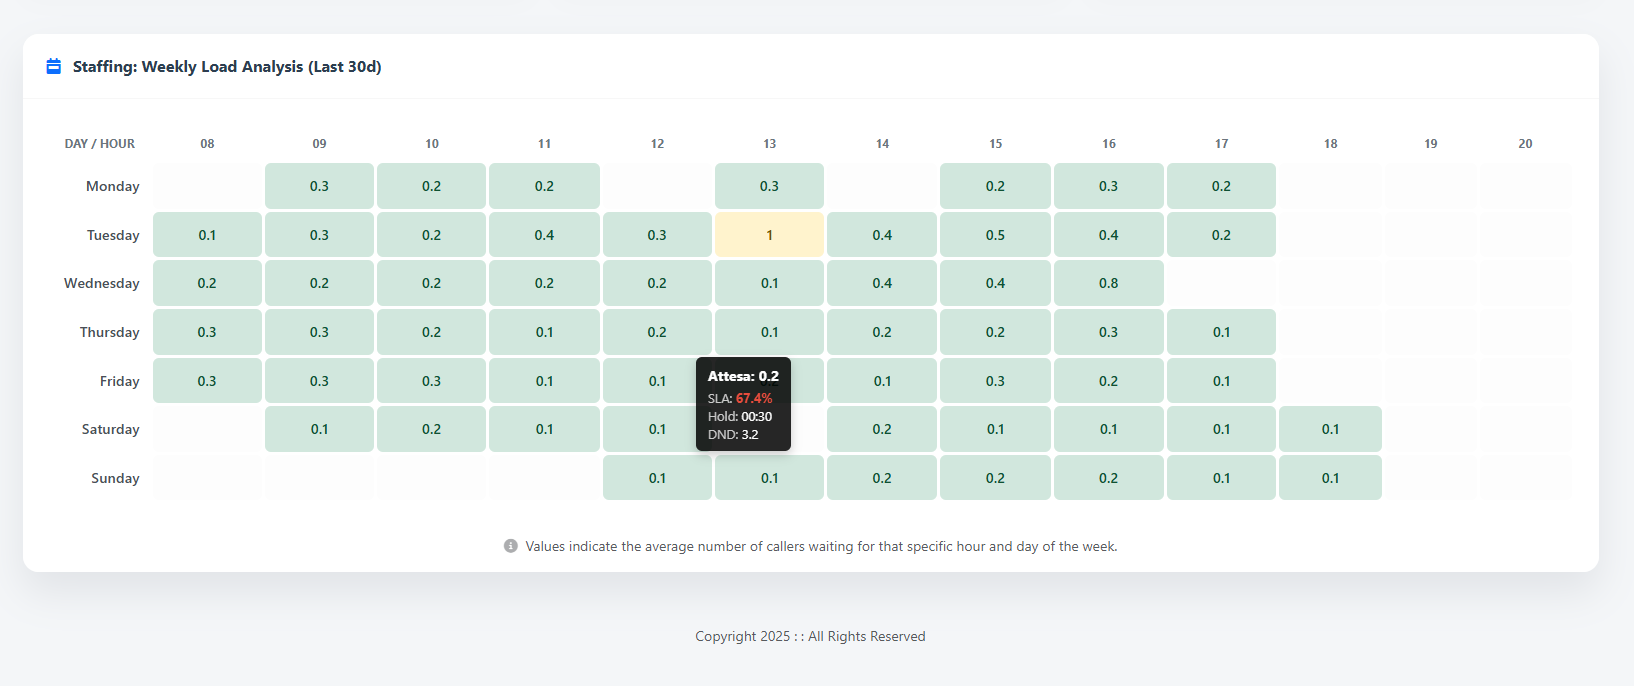
The monthly Staffing function allows you to understand which are the hottest days of the week in terms of workload, this allows a Teal Leader to reorganise the shifts
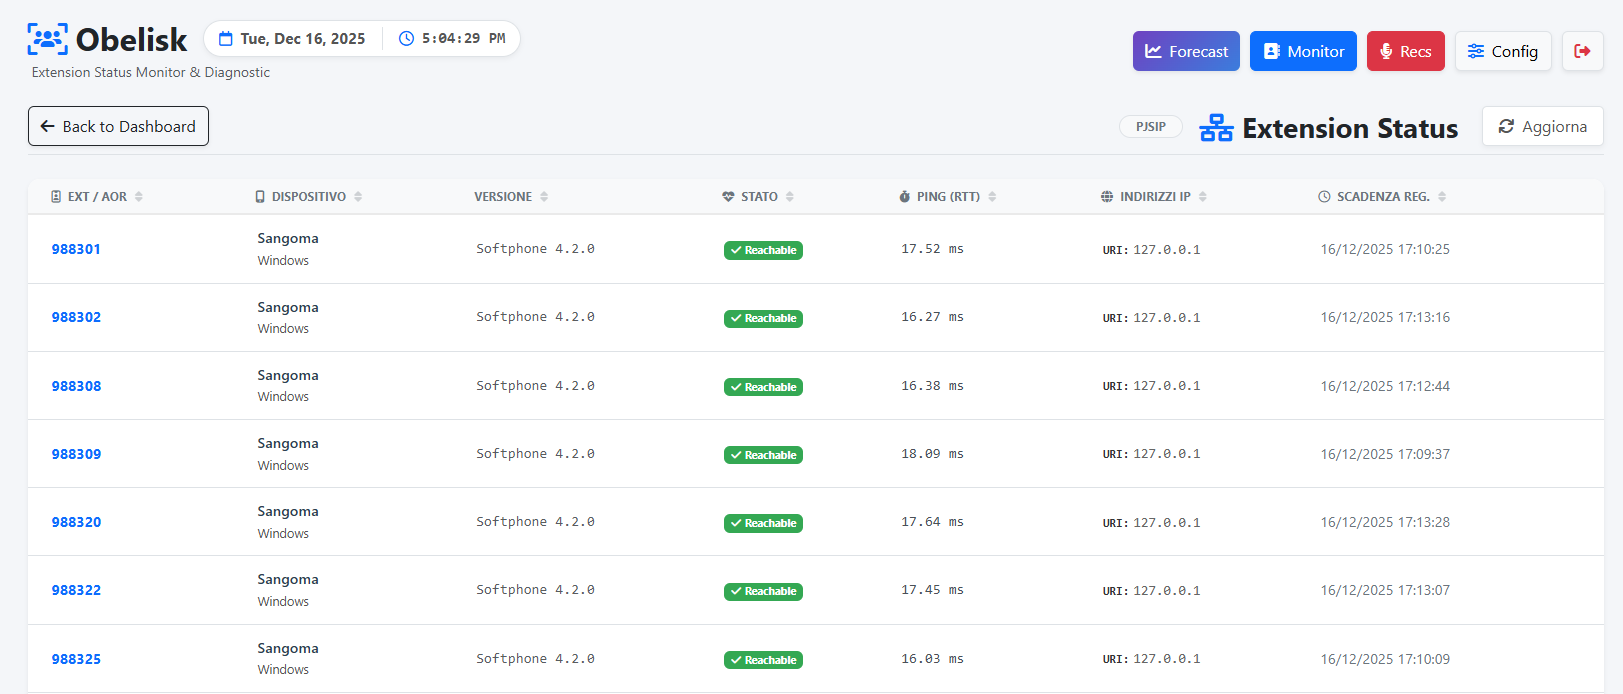
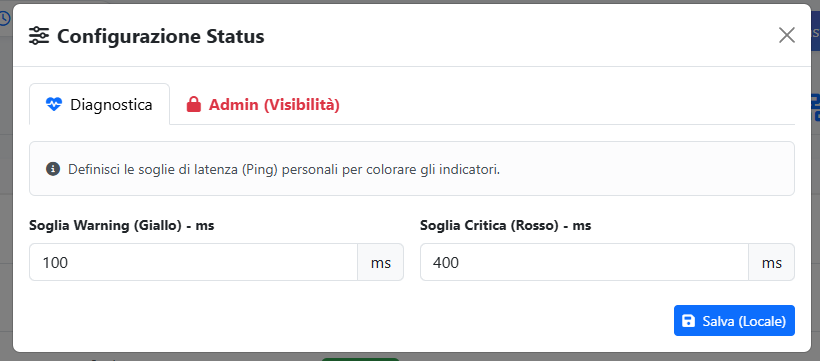
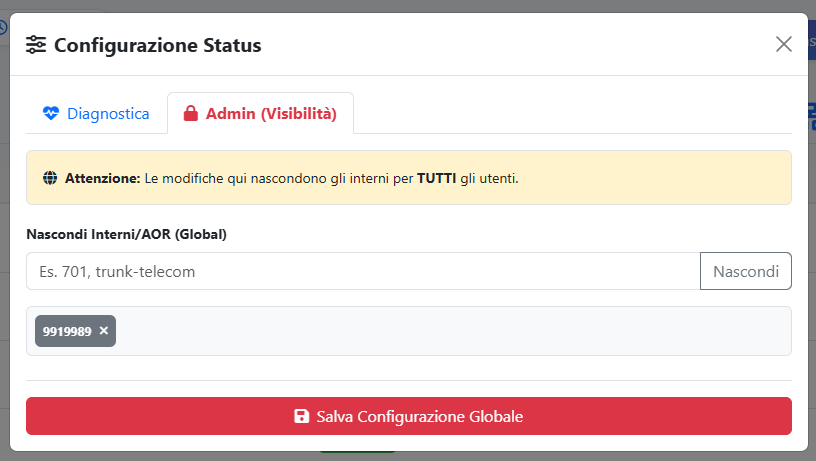
The Extensions section, dedicated to IT, displays the extensions/AORs, the phone model, the installed version, or even the firmware version, such as for broadband phones. This can be useful for determining whether all operators have the latest software or firmware version, the ping time, and the IP address.