High CPU Usage for an idle box

Hi,

So idle box here, nothing really going on. About 8 soft phones connected and not even in calls, no one on the admin, just me over ssh and the load average is 0.60?

I should mention the box is virtualized with Virtual Box.

Is this right?

top - 11:24:25 up  9:49,  2 users,  load average: 0.35, 0.61, 0.59

Tasks: 111 total, 2 running, 109 sleeping, 0 stopped, 0 zombie
%Cpu(s): 5.6 us, 3.0 sy, 0.0 ni, 81.4 id, 7.7 wa, 0.0 hi, 2.3 si, 0.0 st
KiB Mem : 1883096 total, 318436 free, 674504 used, 890156 buff/cache
KiB Swap: 786428 total, 781004 free, 5424 used. 935160 avail Mem

PID USER PR NI VIRT RES SHR S %CPU %MEM TIME+ COMMAND
17555 asterisk 20 0 412672 35296 11112 S 11.8 1.9 0:00.60 php
13219 mysql 20 0 1695068 135732 9160 S 11.2 7.2 0:30.50 mysqld
1901 asterisk 1 -19 3134504 59276 18156 S 5.9 3.1 36:21.76 asterisk
846 mongodb 20 0 678996 52000 21404 S 2.0 2.8 17:28.14 mongod
3 root 20 0 0 0 0 S 1.6 0.0 0:10.86 ksoftirqd/0
18 root 20 0 0 0 0 R 1.3 0.0 0:12.74 ksoftirqd/2
175 root 0 -20 0 0 0 S 1.0 0.0 0:30.31 kworker/3:1H
17494 root 20 0 155636 2164 1484 R 1.0 0.1 0:00.50 top
26329 root 20 0 0 0 0 S 1.0 0.0 0:37.23 kworker/2:2
9 root 20 0 0 0 0 S 0.7 0.0 1:26.98 rcu_sched
13 root 20 0 0 0 0 S 0.7 0.0 0:14.11 ksoftirqd/1
7 root rt 0 0 0 0 S 0.3 0.0 0:07.47 migration/0
23 root 20 0 0 0 0 S 0.3 0.0 1:12.20 ksoftirqd/3
195 root 20 0 0 0 0 S 0.3 0.0 0:16.40 jbd2/sda2-8
660 root 20 0 543608 25460 16988 S 0.3 1.4 0:14.45 httpd

Your 5-minute average LA is over 0.6. Your current LA is 0.35. Whatever is happening isn’t happening right now…

It comes and goes. Here’s it again. I mean 42% usage just sitting there, and why php, no ones even on the admin.

[root@localhost ~]# top

top - 15:02:59 up 3:32, 2 users, load average: 0.42, 0.55, 0.44
Tasks: 112 total, 1 running, 111 sleeping, 0 stopped, 0 zombie
%Cpu(s): 16.8 us, 1.9 sy, 0.0 ni, 79.2 id, 0.1 wa, 0.0 hi, 2.0 si, 0.0 st
KiB Mem : 1883096 total, 136888 free, 850596 used, 895612 buff/cache
KiB Swap: 786428 total, 786428 free, 0 used. 775316 avail Mem

PID USER PR NI VIRT RES SHR S %CPU %MEM TIME+ COMMAND
7146 root 20 0 487920 111696 11320 S 74.3 5.9 0:03.68 php
1617 asterisk 20 0 3134416 67084 19416 S 5.3 3.6 14:35.27 asterisk
933 mysql 20 0 1958380 253044 9412 S 2.6 13.4 4:44.04 mysqld
885 mongodb 20 0 678992 70724 36924 S 2.3 3.8 5:39.28 mongod
23 root 20 0 0 0 0 S 2.0 0.0 0:28.31 ksoftirqd/3
54 root 20 0 0 0 0 S 1.0 0.0 0:12.48 kworker/u8:1
7107 root 20 0 155620 2176 1484 R 1.0 0.1 0:00.07 top
9 root 20 0 0 0 0 S 0.7 0.0 0:40.73 rcu_sched
7170 root 20 0 79360 3856 2748 S 0.7 0.2 0:00.02 gpg2keys_hkp
21259 root 20 0 1230596 14900 2488 S 0.7 0.8 1:54.25 fail2ban-server
35 root 20 0 0 0 0 S 0.3 0.0 0:02.78 kworker/0:1
663 root 20 0 543608 25464 16988 S 0.3 1.4 0:05.95 httpd
2505 asterisk 20 0 1139364 108380 13228 S 0.3 5.8 0:51.55 letschat
5701 root 20 0 0 0 0 S 0.3 0.0 0:02.54 kworker/2:2
7169 root 20 0 24816 1568 1252 S 0.3 0.1 0:00.01 gpg2
13343 root 20 0 0 0 0 S 0.3 0.0 0:37.49 kworker/1:1
1 root 20 0 43388 3724 2492 S 0.0 0.2 0:07.06 systemd
2 root 20 0 0 0 0 S 0.0 0.0 0:00.07 kthreadd
3 root 20 0 0 0 0 S 0.0 0.0 0:07.59 ksoftirqd/0
5 root 0 -20 0 0 0 S 0.0 0.0 0:00.00 kworker/0:0H
6 root 20 0 0 0 0 S 0.0 0.0 0:00.00 kworker/u8:0
7 root rt 0 0 0 0 S 0.0 0.0 0:04.40 migration/0
8 root 20 0 0 0 0 S 0.0 0.0 0:00.00 rcu_bh
10 root rt 0 0 0 0 S 0.0 0.0 0:01.05 watchdog/0
11 root rt 0 0 0 0 S 0.0 0.0 0:01.14 watchdog/1
12 root rt 0 0 0 0 S 0.0 0.0 0:07.99 migration/1
13 root 20 0 0 0 0 S 0.0 0.0 0:07.39 ksoftirqd/1
15 root 0 -20 0 0 0 S 0.0 0.0 0:00.00 kworker/1:0H
16 root rt 0 0 0 0 S 0.0 0.0 0:01.15 watchdog/2
17 root rt 0 0 0 0 S 0.0 0.0 0:06.70 migration/2
18 root 20 0 0 0 0 S 0.0 0.0 0:07.21 ksoftirqd/2
20 root 0 -20 0 0 0 S 0.0 0.0 0:00.00 kworker/2:0H
21 root rt 0 0 0 0 S 0.0 0.0 0:01.20 watchdog/3
22 root rt 0 0 0 0 S 0.0 0.0 0:06.55 migration/3
25 root 0 -20 0 0 0 S 0.0 0.0 0:00.00 kworker/3:0H
27 root 20 0 0 0 0 S 0.0 0.0 0:00.05 kdevtmpfs
28 root 0 -20 0 0 0 S 0.0 0.0 0:00.00 netns
29 root 20 0 0 0 0 S 0.0 0.0 0:00.03 khungtaskd
30 root 0 -20 0 0 0 S 0.0 0.0 0:00.00 writeback
31 root 0 -20 0 0 0 S 0.0 0.0 0:00.00 kintegrityd
32 root 0 -20 0 0 0 S 0.0 0.0 0:00.00 bioset
33 root 0 -20 0 0 0 S 0.0 0.0 0:00.00 kblockd
34 root 0 -20 0 0 0 S 0.0 0.0 0:00.00 md
41 root 20 0 0 0 0 S 0.0 0.0 0:00.02 kswapd0
42 root 25 5 0 0 0 S 0.0 0.0 0:00.00 ksmd
43 root 39 19 0 0 0 S 0.0 0.0 0:00.45 khugepaged
44 root 0 -20 0 0 0 S 0.0 0.0 0:00.00 crypto
52 root 0 -20 0 0 0 S 0.0 0.0 0:00.00 kthrotld
55 root 0 -20 0 0 0 S 0.0 0.0 0:00.00 kmpath_rdacd
56 root 0 -20 0 0 0 S 0.0 0.0 0:00.00 kpsmoused
58 root 0 -20 0 0 0 S 0.0 0.0 0:00.00 ipv6_addrconf

There’s your clue.

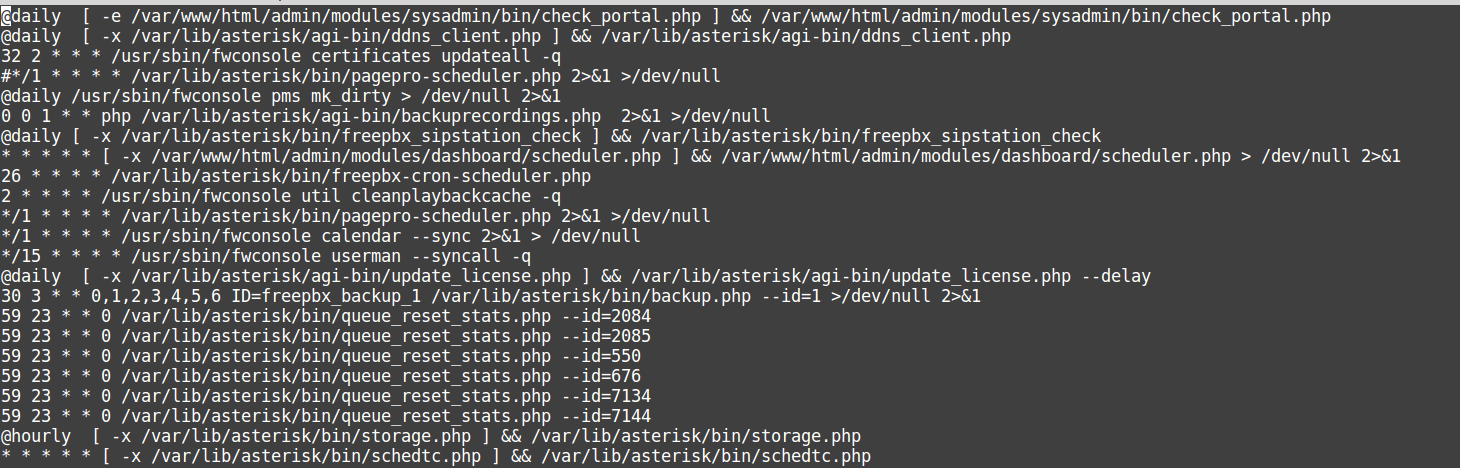
Check your cron jobs for one that runs at the "top of every minute. One of them is running and doing a LOT of work. A quick “ps aux” from the console should steer you in a direction.

There are regular Cron Jobs every 1 min, 5 mins, and 15 mins that jump the load average.

How active is this box and how much call flow is on it? Ours has a lot of both and I can visibly notice jumps every time the cron jobs run, which is expected. Which Freepbx/Asterisk versions?

I have also found a cpu load every minute, maybe it can help you.

The cron jobs? We did look into those and they are a thing but even running them manually over and over don’t seem to cause the random cpu jumps we are getting every few seconds.

We have uninstalled most modules we aren’t using but we are using about 75% of the available ones.

Here is video of what I am seeing:

Normal Operation during the day: https://youtu.be/8edjFDC-f7I

Reload during the day: https://youtu.be/KYtRRwu_de8

Night time mostly idle operation and a reload: https://youtu.be/fTjD-df8S9g

Reloads even while the system is pretty much idle causes call quality issues. We have 2.2ghz cores for asterisk.

Wow, your fwconsole reloads take a very long time.
How many extensions do you have on your system?

All this points to a php culprit. A wild guess is that is being called from crond , I would in one session

tailf /var/log/cron

and in another, run whatever diagnostic you are comfortable with. If they correlate , then “next step”

It’s more the massive call flow rather than the number of extensions. But we have ~ 1900 extensions 1160 of which are being used. While the call flow is being processed I don’t hear any sound issues until it finishes and asterisk switches over to the new dial plan but thats just momentary, really we expect that and its not that bad. Then for a few minutes after load spikes and call quality goes to shit AFTER the reload is done.

Had a slightly smaller number before moving from Freepbx 13 -> 14 and asterisk was handling the load like a champ and using lower spec hardware.

So you mean your call quality goes to shit for a few minutes after each reload?

Once a minute our cron jobs run and it does cause some spike. We have looked into that and it by itself doesn’t seem to cause any issues so we haven’t been really worried about that. They cause a 30-50% spike in the CPU but we will jump from 50% usage to 200% usage inbetween the cron jobs running.

We only seem to start having any call quality issues once the CPU approaches 250% or above thanks to our reniceing of it, if you haven’t reniced asterisk I would highly suggest it.

Yes. After the Fwconsole reload is finished that is when it goes to shit, it lasts a couple minutes. Any issues while the reload is running have been minor since we reniced asterisk. The moment the reload is finished I hear a small noise but I find that to be expected when switching to a new dialplan.

Edit: I just noticed I hijacked someone else’s thread instead of posting in my own. If a mod wants to here is where this discussion should have been at: Freepbx & Asterisk using far more resources on the Freepbx 14 distro

The point is, WHAT is being run and is it critical ( I doubt that it is probably just for the FreePBX gui) if not critical relegate that cron job to run out of hours only or just on Sunday morning,

Here is what is being ran every minute:

Mar 30 16:55:01 voicelync3 crond[1207]: (asterisk) RELOAD (/var/spool/cron/asterisk)
Mar 30 16:55:01 voicelync3 CROND[23538]: (asterisk) CMD ([ -x /var/lib/asterisk/bin/schedtc.php ] && /var/lib/asterisk/bin/schedtc.php)
Mar 30 16:55:01 voicelync3 CROND[23539]: (asterisk) CMD (/var/lib/asterisk/bin/pagepro-scheduler.php 2>&1 >/dev/null)
Mar 30 16:55:01 voicelync3 CROND[23540]: (asterisk) CMD ([ -x /var/www/html/admin/modules/dashboard/scheduler.php ] && /var/www/html/admin/modules/dashboard/scheduler.php > /dev/null 2>&1)
Mar 30 16:55:01 voicelync3 CROND[23541]: (asterisk) CMD (/usr/sbin/fwconsole calendar --sync 2>&1 > /dev/null)
Mar 30 16:55:01 voicelync3 crontab[23572]: (asterisk) LIST (asterisk)
Mar 30 16:55:01 voicelync3 crontab[23574]: (asterisk) LIST (asterisk)
Mar 30 16:55:01 voicelync3 crontab[23577]: (asterisk) LIST (asterisk)
Mar 30 16:55:03 voicelync3 crontab[23602]: (asterisk) LIST (asterisk)
Mar 30 16:55:03 voicelync3 crontab[23604]: (asterisk) LIST (asterisk)
Mar 30 16:55:03 voicelync3 crontab[23605]: (asterisk) REPLACE (asterisk)
Mar 30 16:55:03 voicelync3 crontab[23607]: (asterisk) LIST (asterisk)
Mar 30 16:55:03 voicelync3 crontab[23609]: (asterisk) LIST (asterisk)
Mar 30 16:55:03 voicelync3 crontab[23610]: (asterisk) REPLACE (asterisk)
Mar 30 16:55:03 voicelync3 crontab[23612]: (asterisk) LIST (asterisk)

We disabled Time Conditions, Pagepro, Dashboard,and Calendar and call quality was still horrible right after a reload.

crontab -e -u asterisk

comment out the stupid ones. (time conditions not so stupid)

I have no idea where these are coming from:

Mar 30 16:55:01 voicelync3 crontab[23572]: (asterisk) LIST (asterisk)
Mar 30 16:55:01 voicelync3 crontab[23574]: (asterisk) LIST (asterisk)
Mar 30 16:55:01 voicelync3 crontab[23577]: (asterisk) LIST (asterisk)
Mar 30 16:55:03 voicelync3 crontab[23602]: (asterisk) LIST (asterisk)
Mar 30 16:55:03 voicelync3 crontab[23604]: (asterisk) LIST (asterisk)
Mar 30 16:55:03 voicelync3 crontab[23605]: (asterisk) REPLACE (asterisk)
Mar 30 16:55:03 voicelync3 crontab[23607]: (asterisk) LIST (asterisk)
Mar 30 16:55:03 voicelync3 crontab[23609]: (asterisk) LIST (asterisk)
Mar 30 16:55:03 voicelync3 crontab[23610]: (asterisk) REPLACE (asterisk)
Mar 30 16:55:03 voicelync3 crontab[23612]: (asterisk) LIST (asterisk)

Everything else we use we have commented out (disabled) and tested without an impact on call quality after a reload. Causes a few less spikes in the CPU but does nothing for the major 200% spikes which seem to be caused by ???.

We can have 1 person in total making a call and it still messes up after the reload is finished.

the only thing you have commented out (pagepro-schedular) is later still there, so you changed nothing

will show you what and when the first five fields are interpreted as. correlate them with your spikes

I know it is not commented out right now. We spent a day looking into Cron as being a source of our issues, testing, and retesting. We found that yes it caused increase loads when the tasks ran but the increases never resulted in call quality problems even when we spammed the cron jobs over and over and over to try and break it.

Disabling all of them did not help after the reload so we accepted that we just have harmless spikes from cron jobs every minute.

reloading 1900 extensions in FreePBX will never be quick, I believe that was improved in newer versions (what are you using ?), I suggest you refrain from reloading during working hours