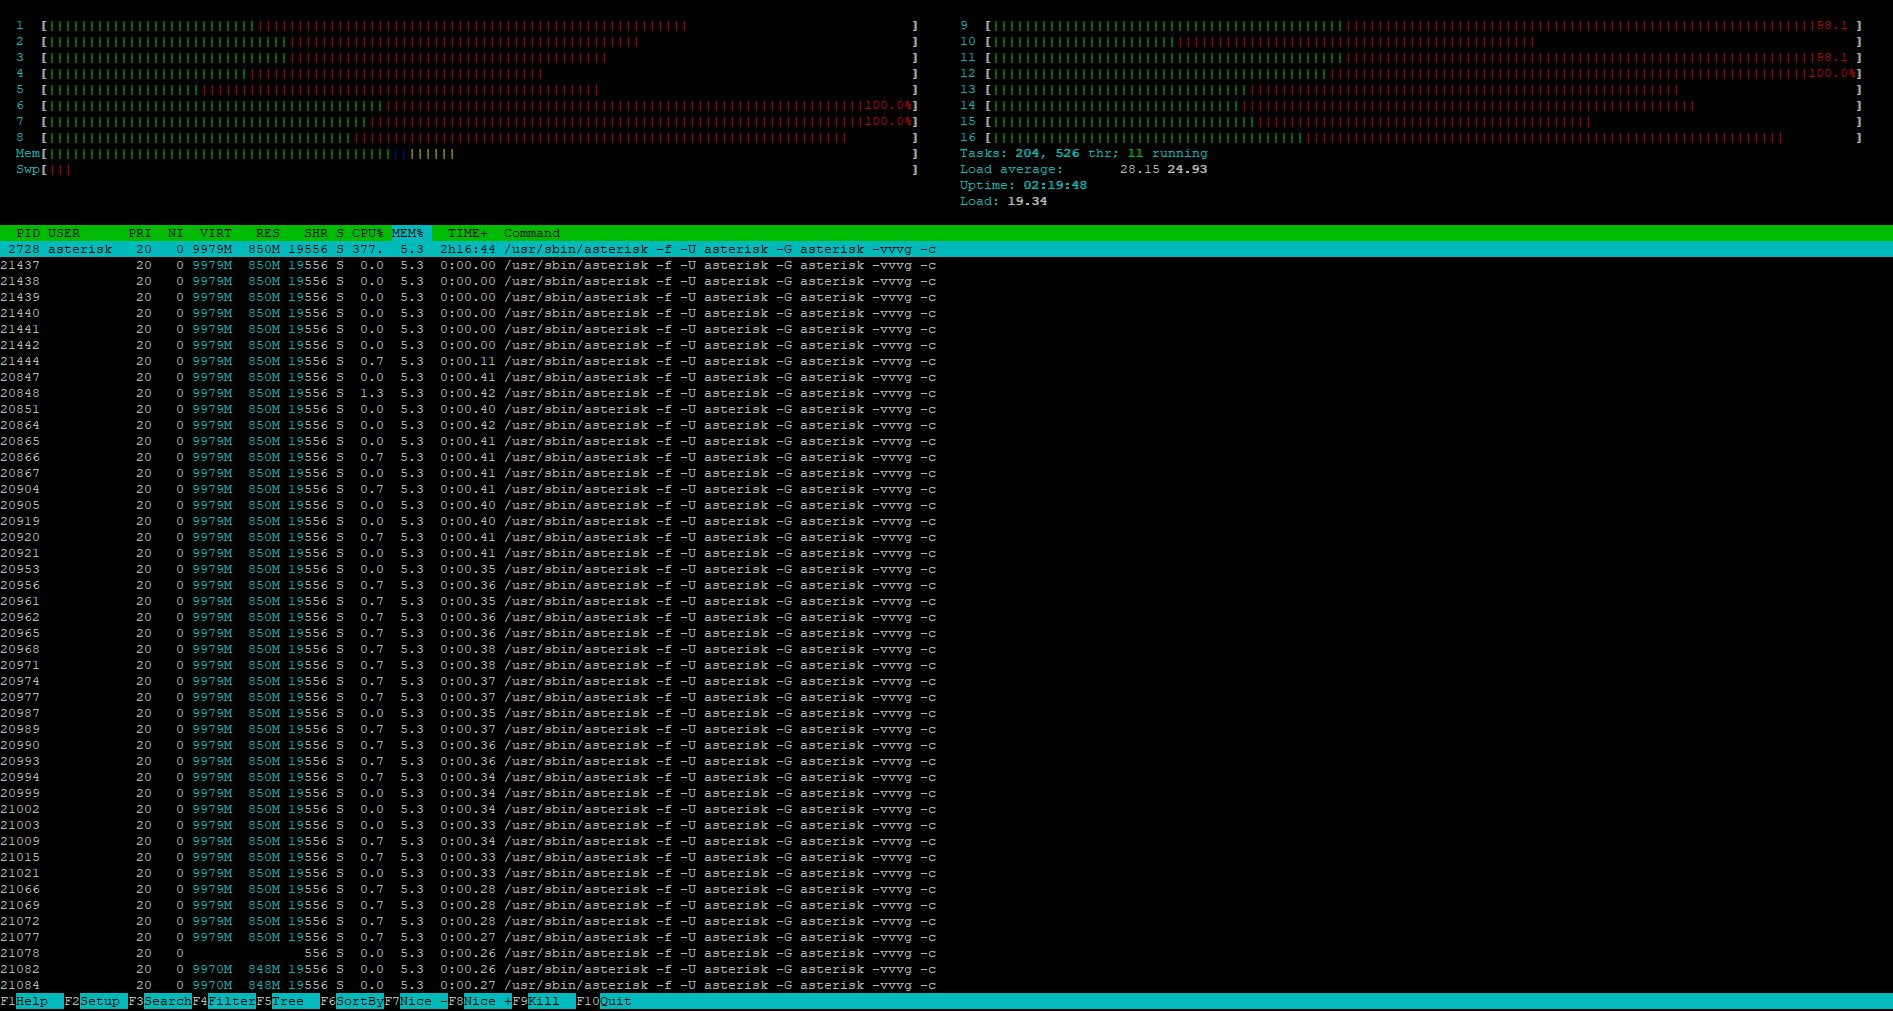
After I upgraded the server to the above versions using the distro-upgrade command the server load has increased hugely. I didn’t change anything else on the server or setup at the same time.
The overload is causing the hold music and IVR menus to run slowly and broken and is affecting call quality too.
The system is now running as a VM on an ESXi host with 8 cores and 8GB Ram allocated to the VM.
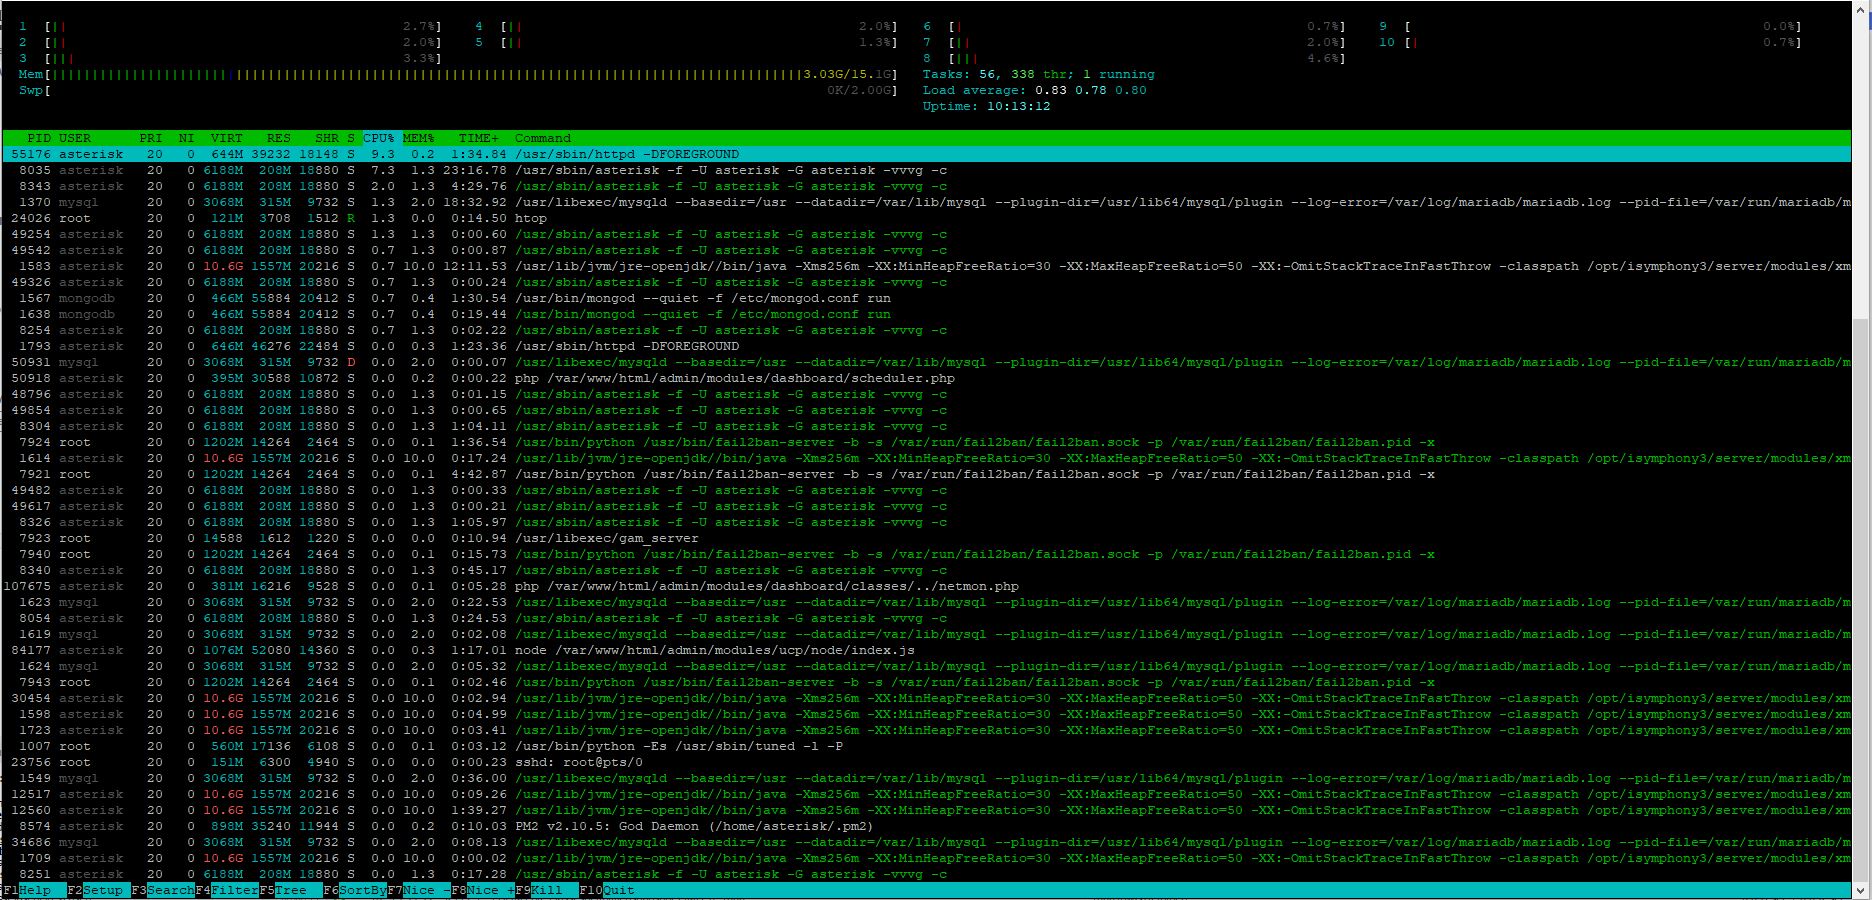
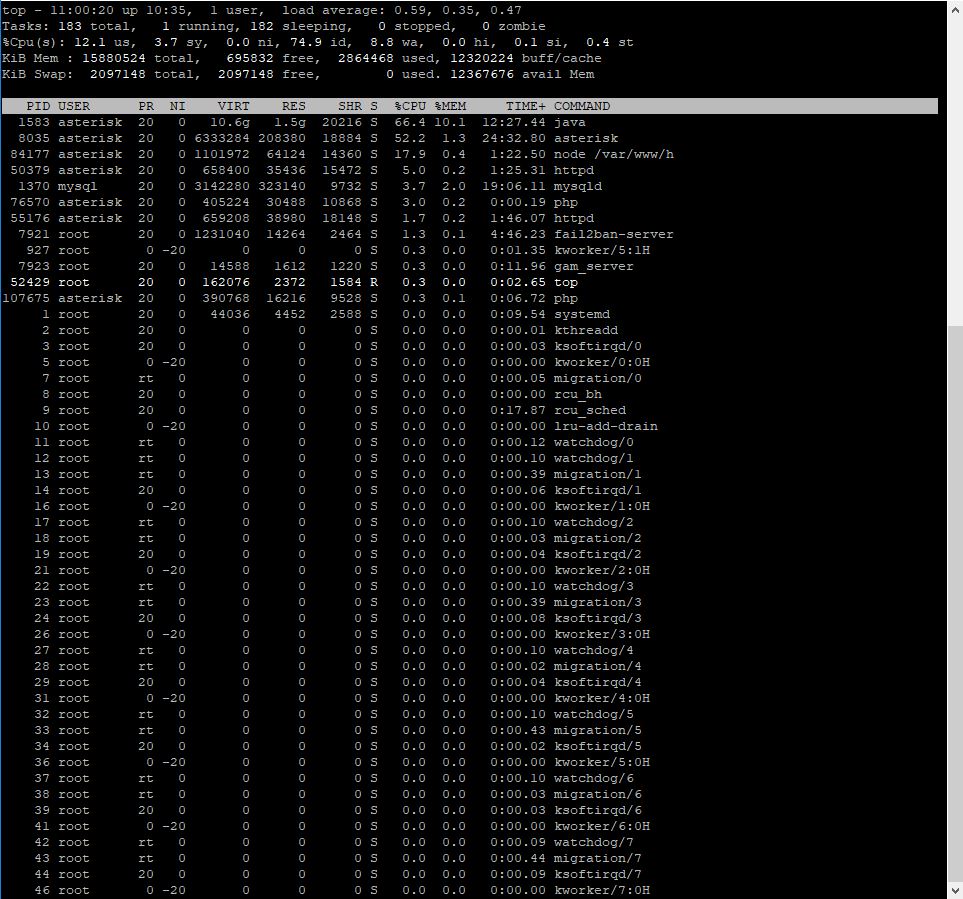
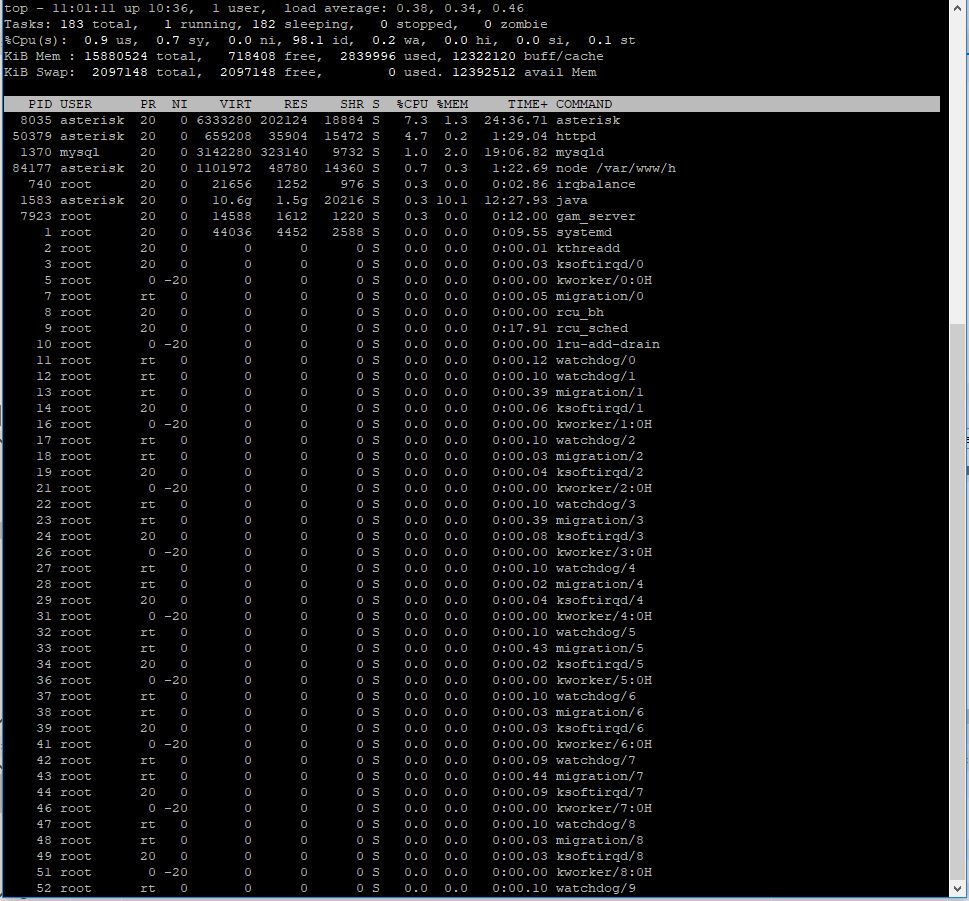
Here is the output of top when there were around 7 live calls on the server (there was only 4GB RAM when I ran this).
Tasks: 169 total,   2 running, 167 sleeping,   0 stopped,   0 zombie
%Cpu0  : 25.2 us, 31.9 sy,  0.0 ni, 40.6 id,  0.0 wa,  0.0 hi,  2.3 si,  0.0 st
%Cpu1  : 26.2 us, 41.9 sy,  0.0 ni, 31.2 id,  0.0 wa,  0.0 hi,  0.7 si,  0.0 st
%Cpu2  : 28.4 us, 36.1 sy,  0.0 ni, 35.1 id,  0.0 wa,  0.0 hi,  0.3 si,  0.0 st
%Cpu3  : 24.7 us, 40.3 sy,  0.0 ni, 34.7 id,  0.0 wa,  0.0 hi,  0.3 si,  0.0 st
%Cpu4  : 31.4 us, 41.9 sy,  0.0 ni, 26.4 id,  0.0 wa,  0.0 hi,  0.3 si,  0.0 st
%Cpu5  : 27.8 us, 37.8 sy,  0.0 ni, 34.1 id,  0.0 wa,  0.0 hi,  0.3 si,  0.0 st
%Cpu6  : 23.4 us, 43.8 sy,  0.0 ni, 32.4 id,  0.0 wa,  0.0 hi,  0.3 si,  0.0 st
%Cpu7  : 25.7 us, 43.7 sy,  0.0 ni, 30.0 id,  0.0 wa,  0.0 hi,  0.7 si,  0.0 st
KiB Mem :  3706348 total,   389940 free,  2120004 used,  1196404 buff/cache
KiB Swap:   786428 total,   581372 free,   205056 used.  1144172 avail Mem

  PID USER      PR  NI    VIRT    RES    SHR S  %CPU %MEM     TIME+ COMMAND
16267 asterisk  20   0 5294480 216468  13252 S 316.9  5.8 201:13.77 asterisk
15545 root      20   0   78128   4348   3356 S  59.3  0.1  27:00.14 asterisk
 1176 asterisk  20   0 6846884 953524   8332 S  38.4 25.7 159:12.90 java
25731 asterisk  20   0 1096072  68460   6464 S  12.9  1.8  14:04.72 node /var/www/h
30712 asterisk  20   0  419296  44304  10864 S   9.9  1.2   6:16.29 php
16633 asterisk  20   0  407644  33192  10840 S   9.3  0.9  12:30.80 php
31576 root      20   0  148128   5284   3964 S   5.3  0.1   0:43.35 sshd
13567 root      20   0   78128   4348   3356 S   4.0  0.1   0:24.08 asterisk
30690 asterisk  20   0  305220   9000   6192 R   3.3  0.2   0:00.10 php
29685 root      20   0       0      0      0 S   1.0  0.0   0:00.41 kworker/7:0
29879 root      20   0       0      0      0 S   1.0  0.0   0:00.39 kworker/6:0
    9 root      20   0       0      0      0 S   0.7  0.0   2:31.83 rcu_sched
 1026 mongodb   20   0  581136   9880   2752 S   0.7  0.3  17:26.01 mongod
22400 root      20   0       0      0      0 S   0.7  0.0   0:15.96 kworker/3:0
30588 root      20   0       0      0      0 S   0.7  0.0   0:00.04 kworker/0:1
 1050 mysql     20   0 2091148 377468   5764 S   0.3 10.2 133:49.29 mysqld
 4324 root      20   0       0      0      0 S   0.3  0.0   0:09.20 kworker/4:2
 6491 root      20   0       0      0      0 S   0.3  0.0   0:10.71 kworker/2:2
16741 asterisk  20   0 1145628 109432   6528 S   0.3  3.0   2:06.88 letschat
20027 root      20   0  160024   2360   1528 R   0.3  0.1   0:53.34 top
24375 root      20   0       0      0      0 S   0.3  0.0   0:02.74 kworker/1:2
32625 root      20   0       0      0      0 S   0.3  0.0   0:12.80 kworker/5:1
    1 root      20   0  191132   3040   1888 S   0.0  0.1   0:18.54 systemd
    2 root      20   0       0      0      0 S   0.0  0.0   0:00.29 kthreadd
    3 root      20   0       0      0      0 S   0.0  0.0   0:09.87 ksoftirqd/0
    5 root       0 -20       0      0      0 S   0.0  0.0   0:00.00 kworker/0:0H
    7 root      rt   0       0      0      0 S   0.0  0.0   0:01.20 migration/0
    8 root      20   0       0      0      0 S   0.0  0.0   0:00.00 rcu_bh
   10 root       0 -20       0      0      0 S   0.0  0.0   0:00.00 lru-add-drain
   11 root      rt   0       0      0      0 S   0.0  0.0   0:01.52 watchdog/0
   12 root      rt   0       0      0      0 S   0.0  0.0   0:01.33 watchdog/1
   13 root      rt   0       0      0      0 S   0.0  0.0   0:01.20 migration/1
   14 root      20   0       0      0      0 S   0.0  0.0   0:00.73 ksoftirqd/1
   16 root       0 -20       0      0      0 S   0.0  0.0   0:00.00 kworker/1:0H
   17 root      rt   0       0      0      0 S   0.0  0.0   0:01.31 watchdog/2
   18 root      rt   0       0      0      0 S   0.0  0.0   0:01.17 migration/2
   19 root      20   0       0      0      0 S   0.0  0.0   0:00.92 ksoftirqd/2
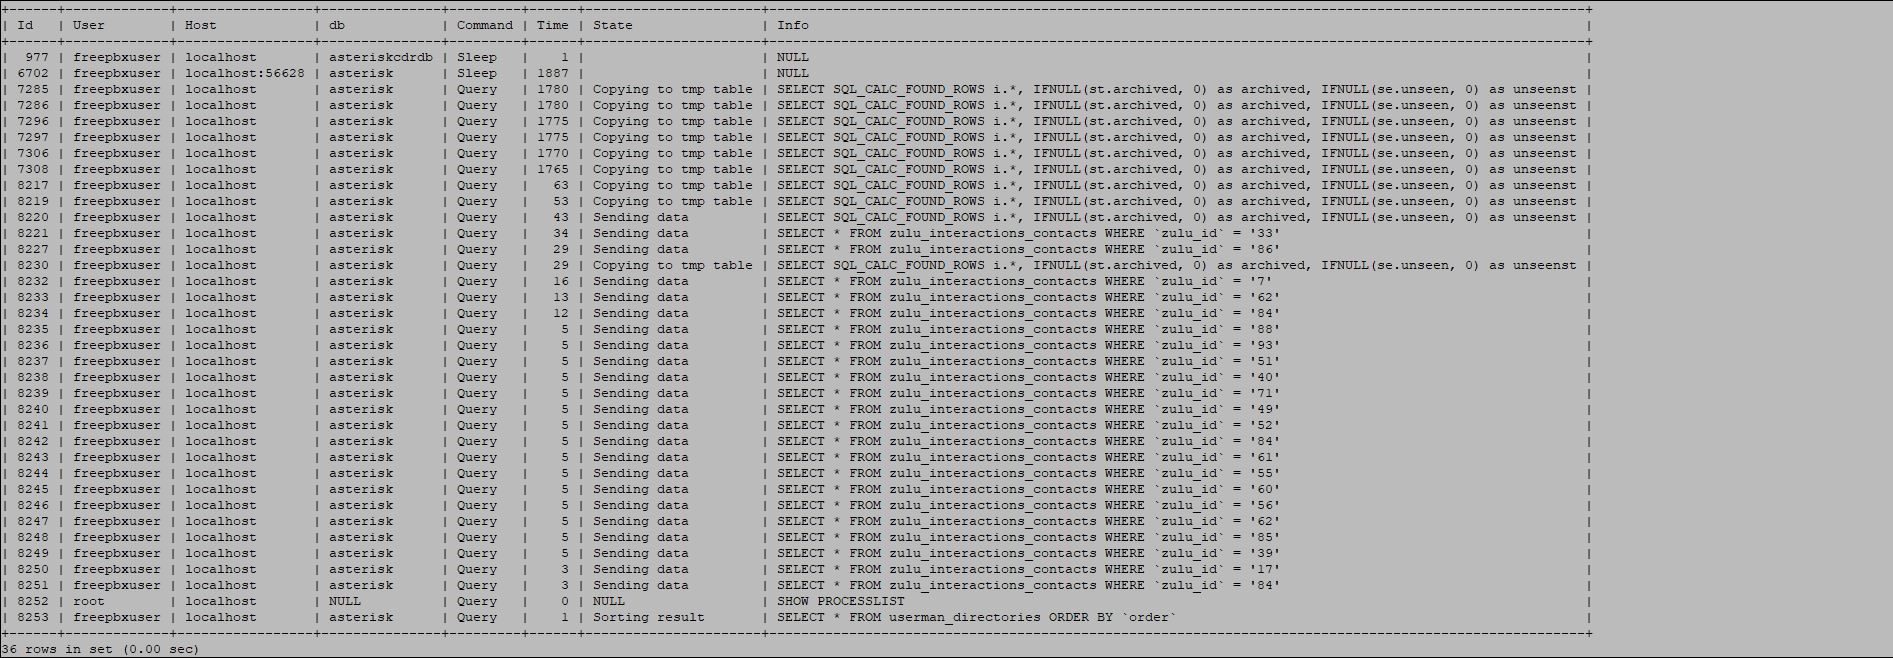
The process causing the problem is always the asterisk one.
I disabled remote CDR logging, call recording and some other things and it didn’t make a difference to the load.
Even ringing from one extension to another when there is no other server activity will push CPU load to 50% viewed using top.
I have looked at other threads regarding this and although a few other people have had this problem, no one seems to have found the cause. Please could someone help as I am not sure how to work out what the problem is.