Detail your actual problems and setup. @adtopkek didn’t mention anything specific in this thread and in other threads there hasn’t been much to support the claims. No one has actually been able to do anything because no one has provided real debugs or information of substance. You could break that cycle.
What debug information could I provide which would help someone diagnose the problem, I asked in the first place what I needed to do to try to get to the bottom of this issue?
Thanks
How long after a startup do the problems start to manifest? And if you restart the service, like Asterisk, does the issue go away and then creep back up on you?
It’s instant for us, it is using too much server load as soon as it first starts up and doesn’t get worse as time goes on. The closest answer I found online was one where someone identified hardware interrupts as the source of the problem but I am not sure what to do to test for this condition.
So now the other part I asked for earlier. Describe your setup. You’ve got 8 cores and 8GB of RAM but now what is the rest?
How many endpoints/peers by tech?
How many Queues?
Is there Call Recording?
What Codecs are being used?
How much transcoding has to happen?
How many devices have BLFs and how many BLFs overall?
What is the average expire time set for REGISTER/SUBSCRIBE’s?
What is the average Qualify time set for all endpoints?
I think those are good to start with.
well I started the VM with 2 CPU and 2 Cores per CPU 8 GB ram, when I first deployed, I had about 60 Peers and about 10-15 active calls at any one point in time, now I have 87 peers and about 25-30 active calls at any point in time the VM has 4 cpus and 8 per cpu now 16 GB ram. we have 3 queues, no call recording, codes are ulaw, alaw, gsm, g726, and g722 in that order. I don’t know what transcoding is, sorry can’t answer that one. almost all of our peers have BLF’s setup, and many of them have all 20 used, and it has been that way since roll out. not sure about the registrer/subscribe part, my sip settings have 20 for registration timeout, 0 for registration attempts, 60 for minimum expiry, and 3660 for registration max expiry, registration default expiry is 3600. I don’t know what qualify time is either… sorry, if you can tell me where to get that I’ll be happy to get the number.
Transcoding is when my phone calls the PBX and uses ulaw and the other peer (trunk or other extension) I called is using g722. You would need to transcode the ulaw to g722 and vice versa. Transcoding adds load and takes up resources on the system. If you have devices and/or your trunk all ending up using different codecs during calls, your system will be doing a lot of transcoding.
It is defaulted to 60 seconds, if you haven’t touched it then it is 60 seconds.
So you have 87 peers that would mean at least 80-85 would be qualified (unless all your trunks are too then 87) so that means every minute you are sending out 87 OPTION messages. If a single call triggers all the phone’s BLF then you’re sending 80-ish (let’s say) NOTIFY’s with each state of the phone being called Ringing/IN_USE/Hangup (NOT_INUSE).
More importantly, I’m looking at your reports and not focusing on the things you point to in the screenshoots and when you do that you see that:
Your first set of screenshots so a Load Avg of 0.44, 0.67, 0.77. The next one showed 0.69, 0.79, 0.80. Your TOP screenshot shows 74.9% of your CPU power at IDLE. Even the second screenshot that seems to be missing the 5 min avg shows the 10 and 15 min avg at 20.10, 24.99. Not at this point I’m guessing you’re up to 8 cores.
What this tells me is that during the time you had 4 Cores you barely got up above using 100% of a single core. With your system at 8 Core I don’t see a serious amount of “taxing”. Even this shows it’s not that bad:
Yes, the load is spread across all the cores because that’s how it works and always happens. So you’re floating around 25-30% usage per core which means 2 full cores (and some change) are in use at the time. With an 8 core machine that means you are using roughly a QUARTER (25%) of CPU power.
So again, I’m failing to see how this is having a high CPU load. Also you didn’t specific the tech of your peers. Again, you are relating this to a problem someone else had. They said it was all an issue with PJSIP, are you using PJSIP for all these peers?
1 Like
when I took those screen shots it wasn’t that bad, the only time it gets bad is when we have 30 or more calls coming in at the same time. next time I see the processors peaking, I’ll grab some more screen shots, but it got bad enough the other day before I added the other 4 CPU’s that I could not even load the admin for Freepbx. I was getting all kinds of error messages something about Exception: SQLSTATE[08004] [1040] Too many connections::SQLSTATE[08004] [1040] Too many connections, and call quality was horrible.
That should give you pause and concern. That error is stating that MySQL can’t accept more connections so that means things like CDRs and other things that write “real-time” to the database during/after calls and yeah, that will slow down your calls since the system is waiting to connect and get a response from the MySQL server and dying.
Look, you have numerous codecs that are accepted by the PBX. Two of those gsm and g726 are not being used at all (or shouldn’t be) and alaw is for non-North America setups. If you’re not sure what codecs are being negotiated for your calls and you have no idea if your transcoding then you have no idea if that is causing the load to increase with each call.
Most people end up putting their system recordings on the system in WAV format, that still requires transcoding to ulaw or whatever codec being used. If you have 10 people in a queue then that is 10 MoH/system recording streams you have going at a time, that will mean those WAV files are being transcoding out to ulaw for those calls over the trunk (assuming ulaw is the chosen codec for the call). So the more callers that end up in the queue then the more audio you are streaming and possibly transcoding.
How many of those 25-30+ calls are in the queue at any given time and how many are on calls with agents/users? You also haven’t answered my question on the tech being used for the trunks/endpoints. Is this Chan_SIP or PJSIP?
sorry, it wasn’t on purpose. we use all Chan_SIP, no pjsip. I’m pretty sure all of our calls use ulaw, and yes, all of our recordings are in WAV format, but I can change those to ulaw. no one should be in the queue for any real length of time, maybe 2-3 seconds. I’ll remove alaw, and the other ones I don’t think we use any of the others, just had them there “in case” didn’t have a clue when I setup the pbx… sadly it was just a little too easy and didn’t really have to learn much to get it up and running… I saw lots of zulu lookups in the mysql screen shot, is that some of the mysql issue? I change my default max_connections = 100 to 300, and I haven’t seen that message since that change.
Well if you don’t need modules like Zulu or others, disable them so they aren’t running in the background taking up resources. Don’t need iSymphony, get rid of it that kills the need to have JAVA running on the system because nothing else uses it. Don’t need Zulu? Like I said, dump it. It will stop the Zulu server from running in the background and adding Zulu based commands in the dialplan to be executed during calls. Same with the CRM, kill it if you don’t need it.
People tend to forget something, this is not Asterisk on its own the FreePBX Distro is running numerous other applications and programs so all the other features can be used. There are cron jobs that run constantly to update settings like TC, etc. You have nodes and other apps to support all that functionality so right off the bat you need CPU/RAM to just make sure the system runs with all the needed apps/programs in an IDLE state without jumping the load up. You need to consider all the other items running on the system outside of Asterisk because yes, they will impact how Asterisk runs.
Also, if you are using Chan_SIP then your issues are not related to the ones others like @adtopkek have pointed out because they are saying this happens on PJSIP and it is to blame. Chan_SIP has always taken more CPU power than PJSIP, it also craps itself a lot easier and more often when it starts to have issues processing calls.
So yeah, you need to show output of load averages when you start having the issue. Showing us stuff when the issue is not happening will not give us the right data as it shows data contradicting your statement.
ok thanks! we do use zulu right now it is not able to load the web page so I pulled a couple of more screen shots.
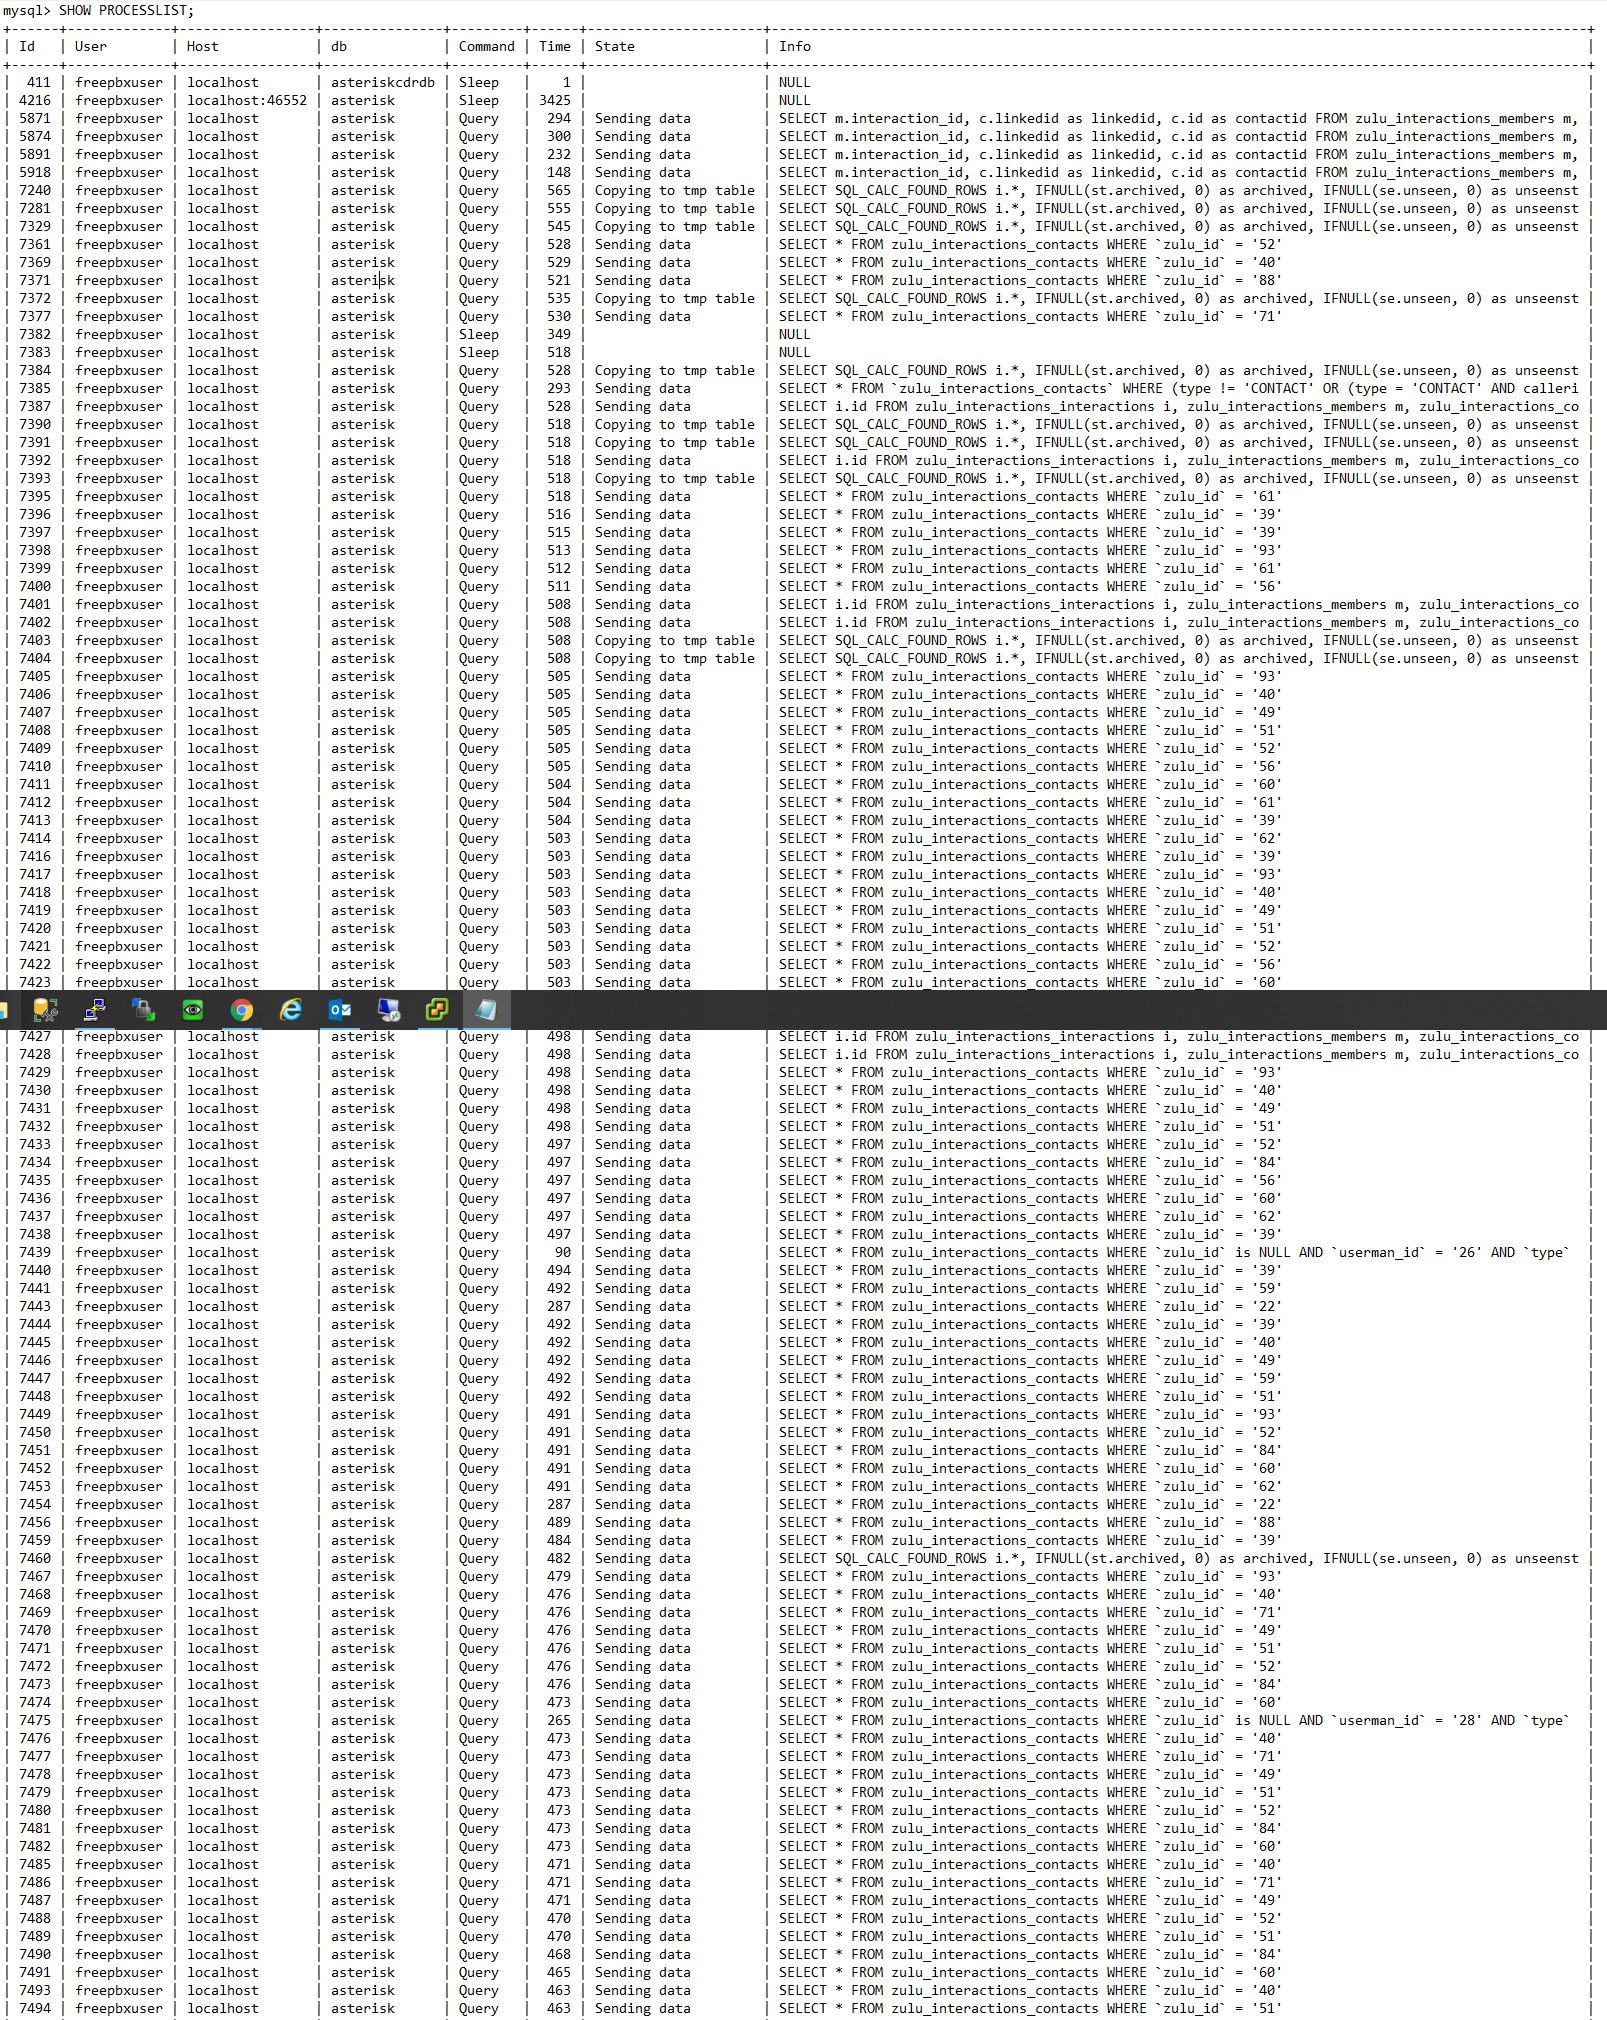
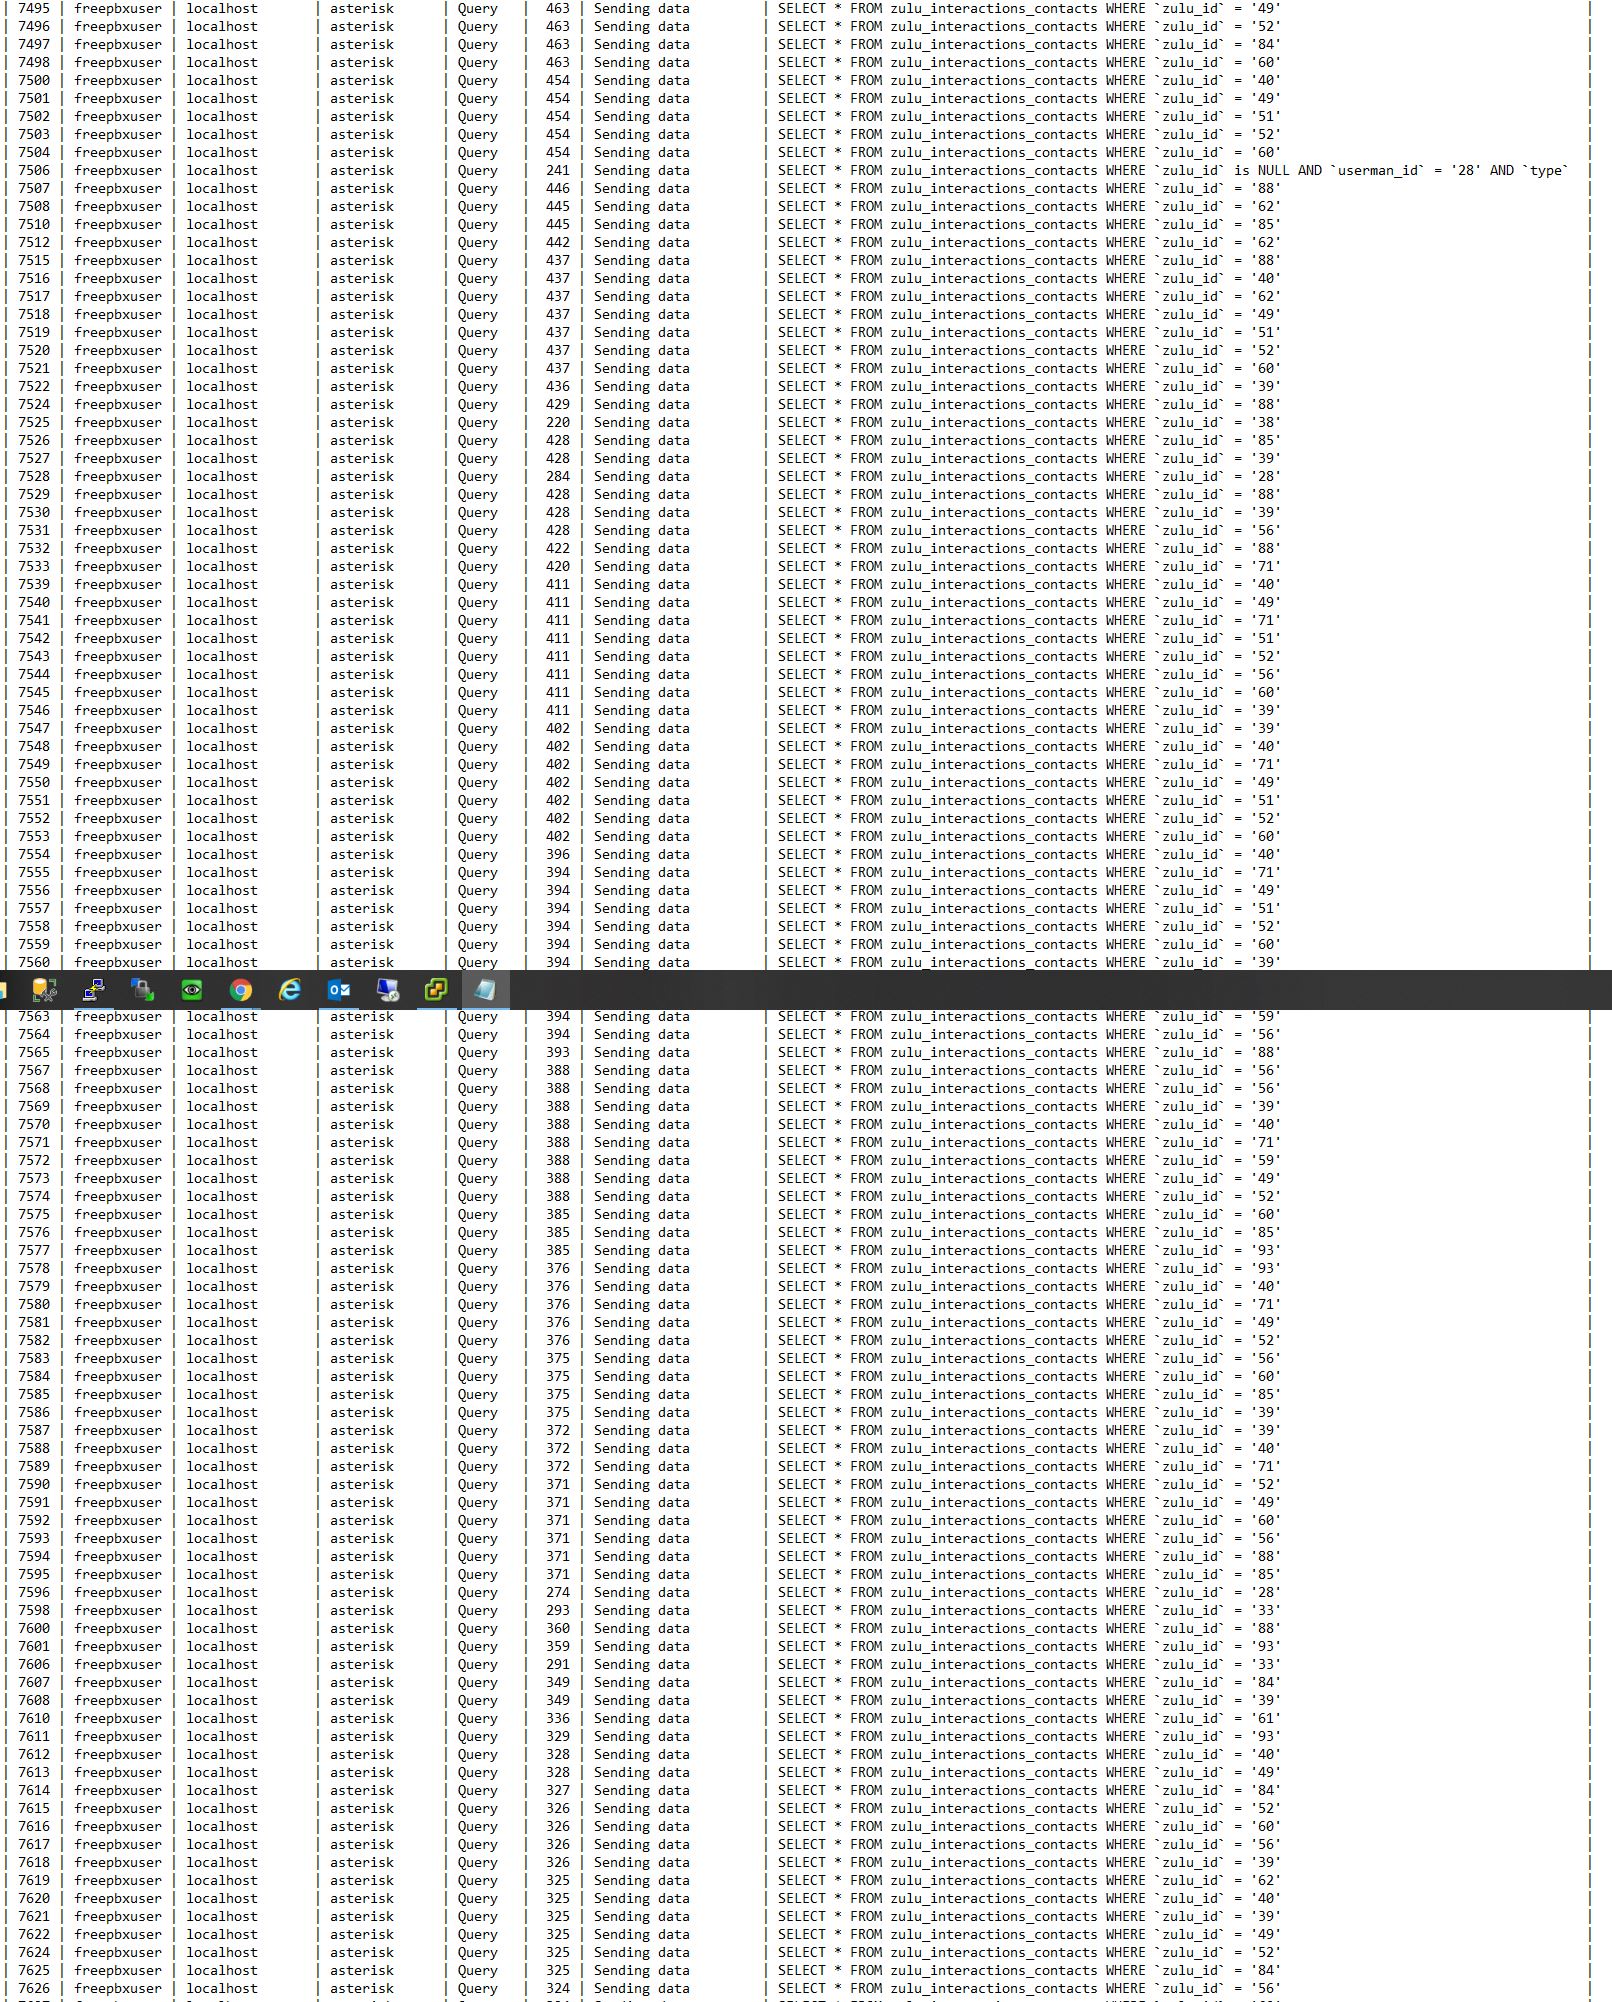
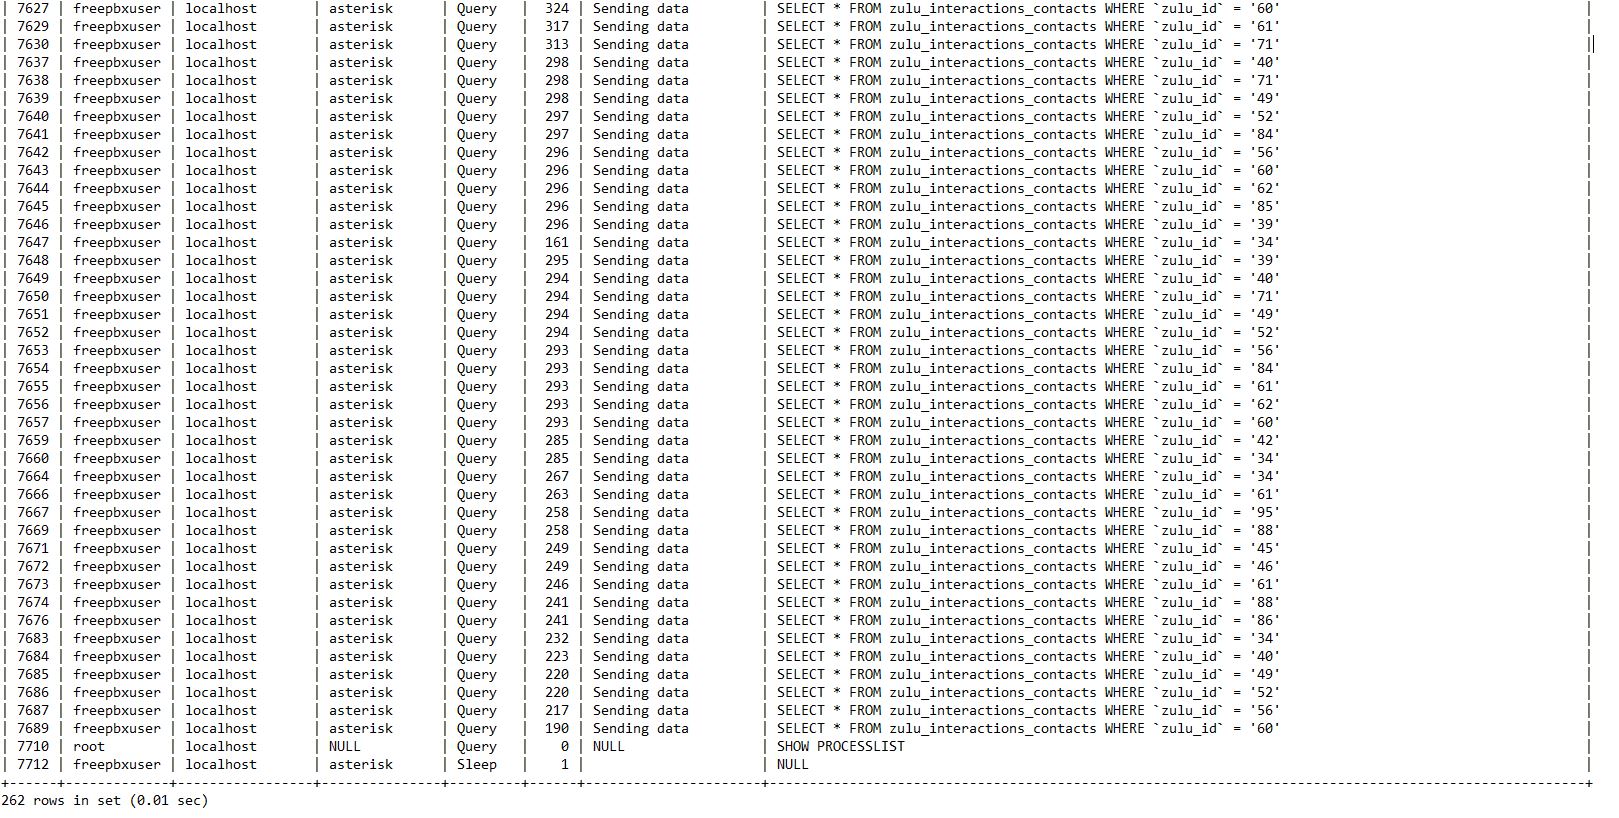
here is the mysql> SHOW PROCESSLIST;
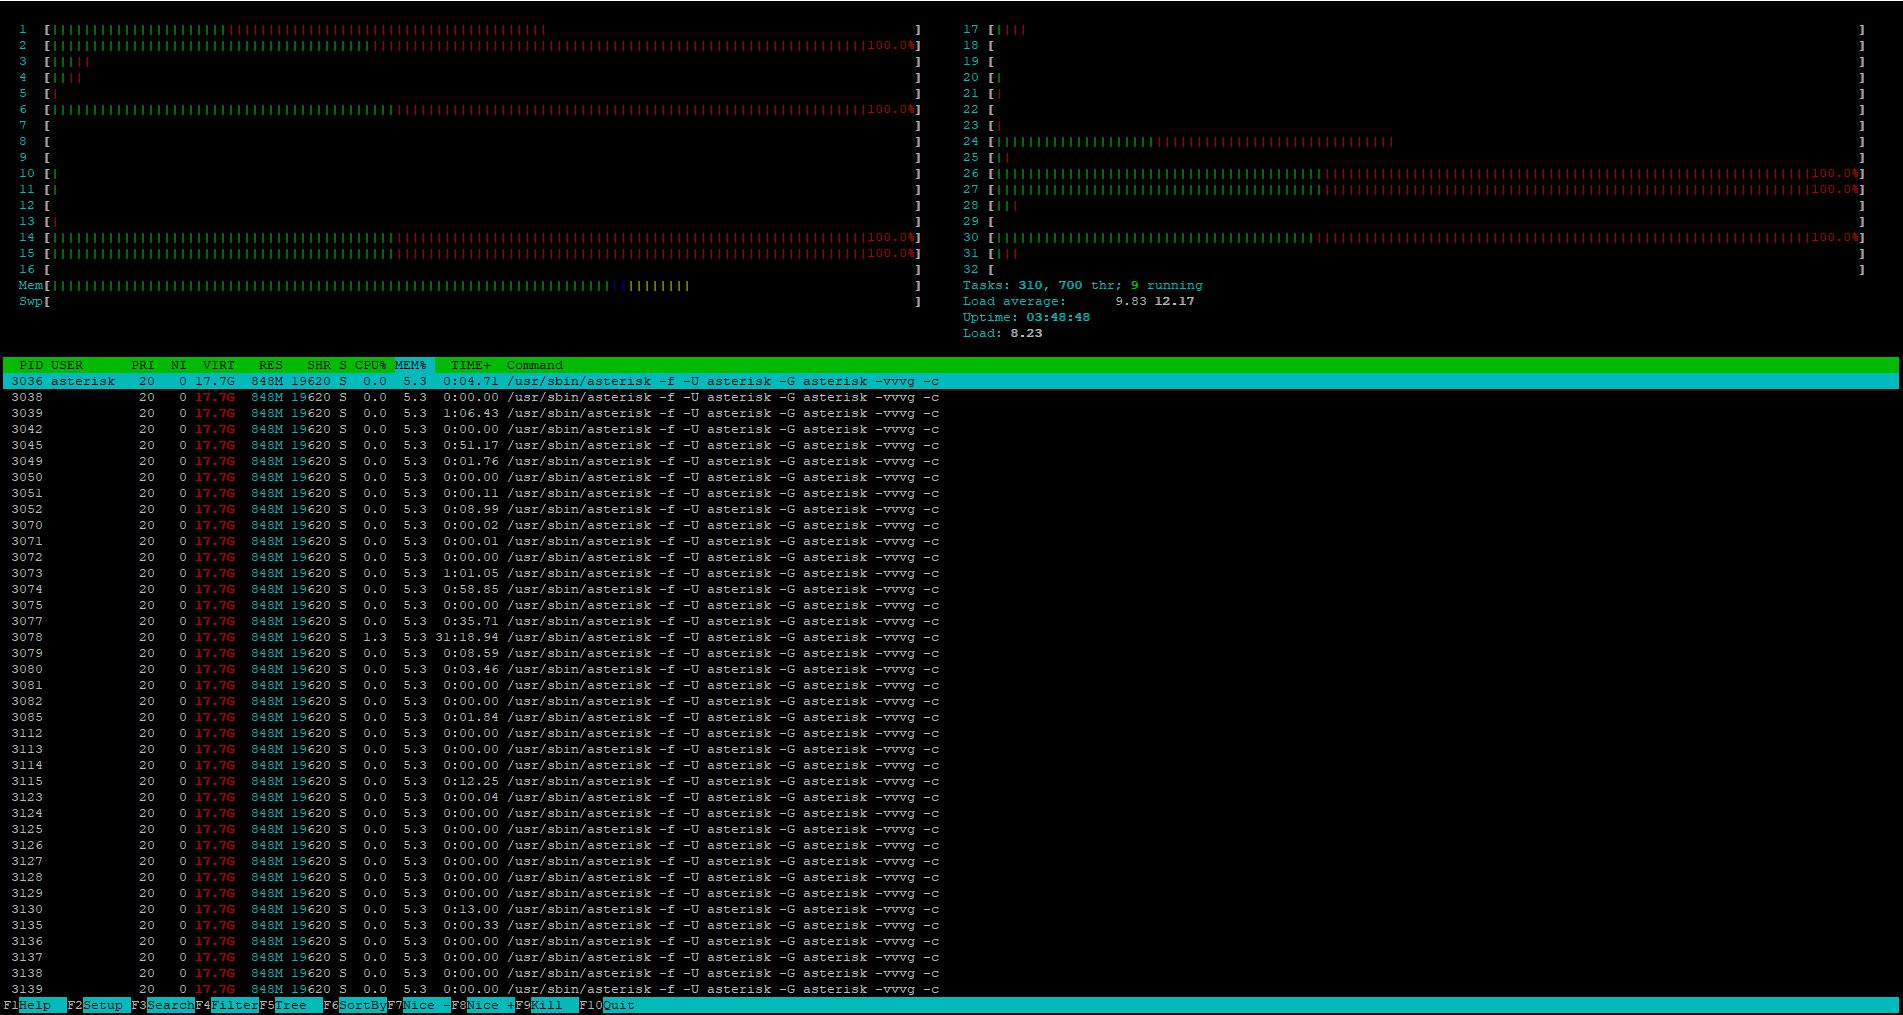
here’s htop.
So this is a Zulu issue it is sounding like or related to it somehow. Since you have a commercial module that seems to the the core of the issue and commercial module support is included with your module, you’ll need to work with Sangoma on this.
Commercial modules are encoded so we, as the users, have no idea how things are coded or being processed via the code in this module.
ok Thanks Tom, I really appreciate the time and effort on this. I’ll get with Support on it. 
There will never be more information from me because it is not my problem to deal with now.
Thanks to the developers for being willing to help me out if I could have gotten a server actually setup for them.
This thread can be closed.
Hi @BlazeStudios, I have noticed that you have got my system confused with chasemixon on at least one post on this thread, sorry for the delay in replying I was away for a couple of days. I will try to answer your questions you listed.
How many endpoints/peers by tech?
48 CHAN_SIP Extensions set up and 25 online. 2 PJSIP (I disabled PJSIP to see if it was at fault but it made no difference).The original reason to upgrade was to have access to the PJSIP and I could change all extensions over if it might help.
How many Queues?
13
Is there Call Recording?
Yes but when I turned it off the server load didn’t change much
What Codecs are being used?
ulaw/alaw we are in UK
How much transcoding has to happen?
Shouldn’t be any with the calls as trunks are using same codecs as the extensions (although looking at the logs I couldn’t work out how to tell which codec was used for a call). Music on hold and messages are wav, same as before the upgrade.
How many devices have BLFs and how many BLFs overall?
None set up apart from the normal line ringing lamps
What is the average expire time set for REGISTER/SUBSCRIBE’s?
I think most of them are set up as 3600
What is the average Qualify time set for all endpoints?
60s default
Zulu Server is turned off and we don’t use iSymphony
@planit Yeah, people hijacked this thread pretty fast and made it very confusing.
So you’re saying that when this machine is booted up and everything is running you immediately see poor call quality? Is that with the first call that is made or does the quality start to degrade over a period of time.
Again, the real issue here is nothing is really standing out. I can’t see why what you have going on right now would cause the call quality issues because for an 8 core system this thing isn’t really showing high load.
Yes, the htop/top shows Asterisk using 316% of the CPU usage but this is a multi-processor system and even if these cores are doing a single thread that is 8 threads being used to handle this so the CPU time calculation is that of all 8 core/threads so it’s going to be 8x (due to 8 core/threads) higher than a single thread/core process. But overall the system isn’t showing to be really “bogged” down.
How many callers sit in the queues on average and for how long?
This topic was automatically closed 14 days after the last reply. New replies are no longer allowed.