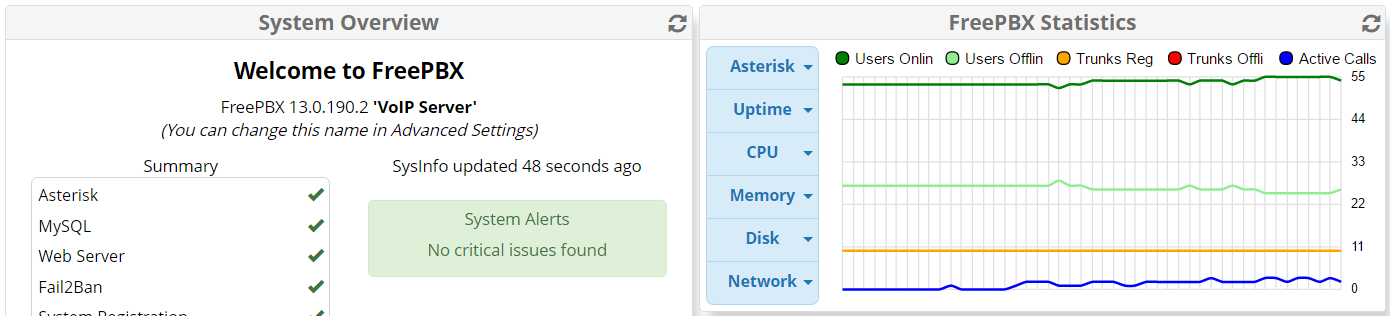
We only have two trunks attached and online.
sip show peers gives this output;
Name/username Host Dyn Forcerport Comedia ACL Port Status Description
2506/2506 X.X.X.X D Yes Yes A 5060 OK (17 ms)
2507/2507 X.X.X.X D Yes Yes A 3414 OK (16 ms)
2511/2511 X.X.X.X D Yes Yes A 3410 OK (16 ms)
nextiva/username# X.X.X.X No No 5060 OK (59 ms)
voip/username# X.X.X.X Yes Yes 5060 OK (16 ms)
5 sip peers [Monitored: 5 online, 0 offline Unmonitored: 0 online, 0 offline]
sip show registry shows this output;
Host dnsmgr Username Refresh State Reg.Time trunking.voipdnsservers.com:5060 Y username# 31 Registered Mon, 14 Nov 2016 10:25:59
atlanta.voip.ms:5060 Y username# 105 Registered Mon, 14 Nov 2016 10:25:02
2 SIP registrations.
We have around a large number of extensions, which are mostly setup with pjsip (minus those three you see above).
Is this a bug that I should report, or is there something else I can check?
Thank you!
-Jon
EDIT: Current Asterisk Version: 13.12.1
Active SIP Channel(s): 5 Active PJSIP Channel(s): 1 Active IAX2 Channel(s): 0
IAX2 Registry: 1
IAX2 Peers:
Online: 0
Offline: 0
Unmonitored: 0
(not sure what “IAX2 Registry: 1” means…we don’t use IAX2, and I can’t find one registered in asterisk)
I’d say there’s something strange going on with your phone system. Not saying you’ve definitely been hacked, but there are a few things in your output that would concern me:
If you don’t have IAX2 trunks set up, then you shouldn’t have IAX2 trunks set up. There’s a “full report” option in the Asterisk Info tab - turn that on and check what’s going on.
You have a couple of “different” VOIP lines connected:
Are those real? If so, cool. If you didn’t set them up as extensions or trunks, there might be a problem.
There are lots of commands that you can use from the “asterisk -vr” prompt that can help you. From the CLI, type “SIP ?” and you will get a list of them. Same for IAX2 and PJSIP.
Thanks for the reply. I don’t believe we are hacked. Responsive firewall and another internal firewall are both on. We just went live with this PBX server on Friday and as soon as all our devices connected, the graph showed the trunks jumped up to 10.
I’m fairly certain we don’t have any IAX2 trunks setup. I just see it says IAX2 Registry 1, in one spot, and no peers right below that. In the full report, everything looks up to snuff. The command “iax2 show registry” shows 0 registrations in asterisk
We have the two phone providers, Voip and Nextiva, which are both setup as trunks and are registered.
All commands that I run match up with what I’m seeing in the asterisk full report. What command would the graph be running to tell it what counts as a trunk?
There is one possibility that I can think of. When you set up your trunks for your providers, did you set up PEER and USER components (filled in both of the screen parts) and did you use “type=friend” for both?
The Nextiva trunk only has PEER Details, and it does use type=friend (no USER Details)
The Voip.ms trunk has PEER Details (type=peer) and USER Details (type=user)
Can you explain the difference?
-Jon
EDIT: I tested disabling the voip.ms trunk, and the graph showed that only one trunk went offline. I don’t think the voip.ms is the one causing the jump in numbers.
Many people set up their trunks with “type=friend” for both their peer and their user trunk components. This has the potential of setting up (at least in theory) a pair of trunks for each (one input and one output for each). This can sometimes make the reporting software decide that each of them counts as two trunks (one in and one out for the user and one in and one out for the peer).
Your trunks sound like they are set up correctly, so that isn’t the issue for you.
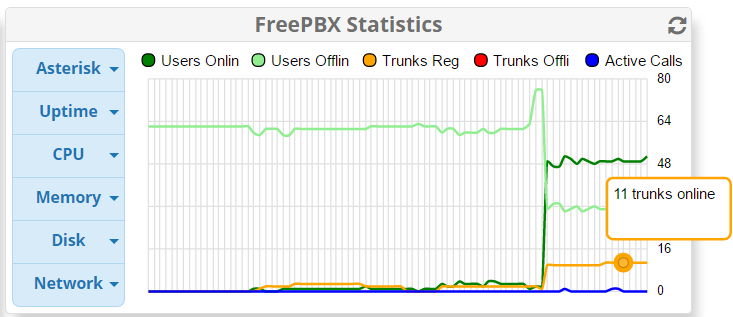
Any thoughts? It is now showing 11 trunks online in the graph, although I am still seeing the same info in my registrations.
As I mentioned it only went up to 10 and now 11, right after the system went live.
Did you ever figure this out? I have the same issue. I used to have 2 trunks, dropped 1, but it still shows 2 active trunks… I even ssh’d into the server and it only shows 1 trunk also…
I have not found the reason for this yet.
Every once in awhile, I’ll see it drop down to 10 trunks for one minute, and then its back to 11.
Our main trunk type=friend, and our backup trunk type=peer.
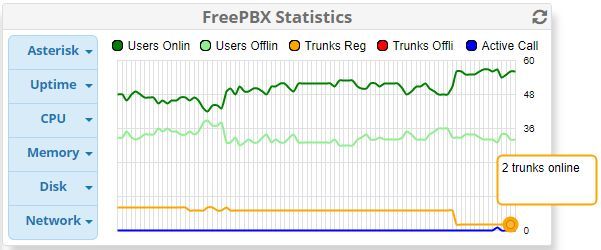
Still unsure of what caused the issue, but it is now reporting properly. I don’t believe we ran updates or anything within the last week or two, but this is a month view from the dashboard graph