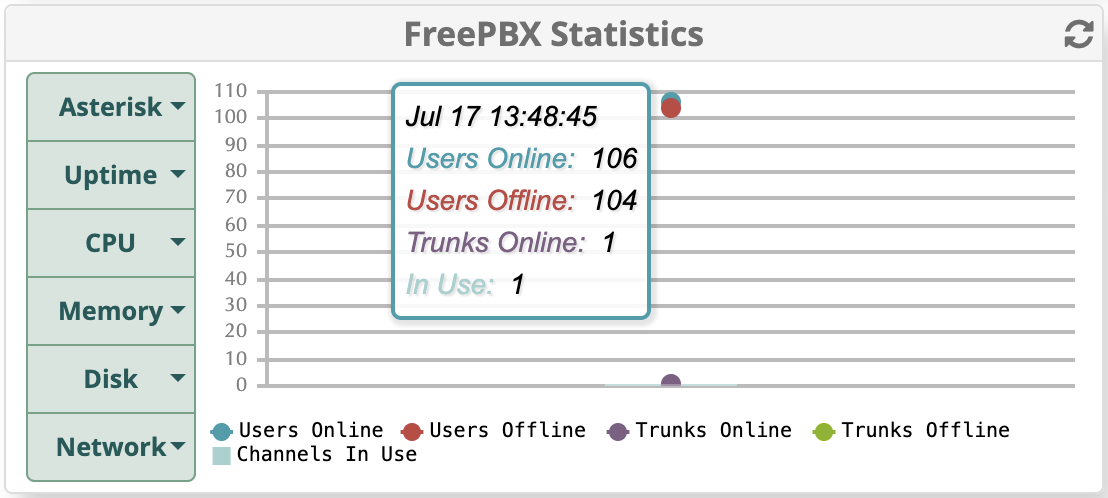
Earlier this week I updated to 17.0.30. Afterwards I noticed that the FreePBX Statistics widget in the admin dashboard won’t refresh. Like when I click the refresh for just that widget. The display just stays stuck as of the time when the dashboard first came up. It used to refresh before for sure. Every now and again I monitor this to see if extensions are flapping, if one client site location might have a connectivity break, etc. If I refresh the entire dashboard page then this widget doesn’t always redraw itself completely.
Like this below. Is this a known bug? The other dashboard widgets refresh individually as expected.
Am I alone in this quirk? I tried the standard mouth-breather stuff, clearing cache, trying a different web browser, etc. Still no luck. It’s not a big deal, just curious if it’s a known issue.
I did run across this older post → https://community.freepbx.org/t/freepbx-statistics-display-window-empty/81183/9. After doing literally nothing, after no reload/reboot, and after no updates being applied, the widget just started working again as usual today. The fact this was previously not working using multiple browsers was indeed quirky. But it’s working now.
Moving that statistics collection to rrdtool and/or collectd would be nice for v18. The hoops that the dashboard module jumps through to achieve largely the same results are not getting any less brittle over time.
I’ve noticed this quirk since I started with FreePBX back in V14, and it’s happened going through them all to V17. It is occasional after doing a framework update. It seems to happen for the first hour after that framework update, than after that hour, it resumes and displays normally. I assumed it was how that data was collected and stored, it may have been getting cleared out so it’s starting fresh at square 1 again. I’m not sure how that works under the hood, but I have noticed it myself, and I manage dozens of servers. It doesn’t happen every time, and not to every server either.
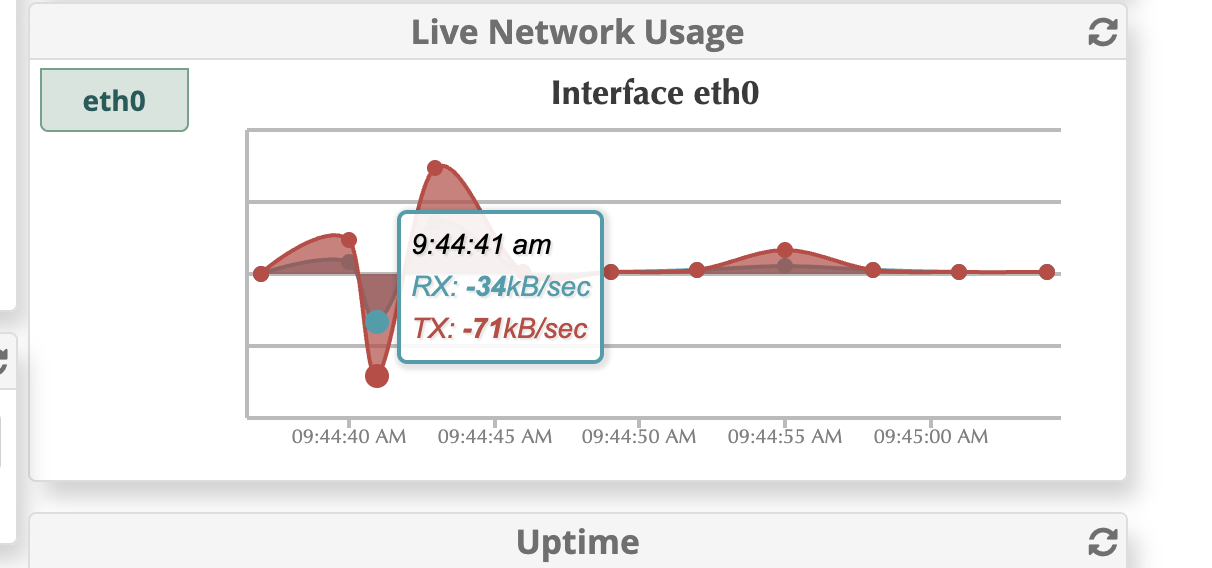
Today I was peeking in at our FreePBX and the dashboard quickly scrolled by for eth0 interface utilization, showing negative figures for a period lol. After awhile the displayed graph “normalizes” until you click the refresh button. Then it is below zero for a bit. Strange, but not a huge deal.