We have a decently busy PBX, average of 60 concurrent calls, about 200 extensions, however no matter how high we scale the hardware, or adjust the thread pools we continue to receive high water warnings, and have had the system lock up and be unable to make outbound calls (and when checking the task processor the queues continue to fill but are not draining). We have always had some taskprocessor warnings, but here and there at most, then recently after an update to the latest version it started being more frequent and then the lockups started.
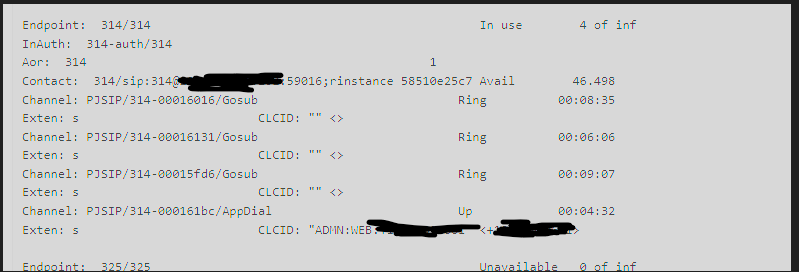
The lockups / issues only affect outbounds, inbounds will continue to work, what we will is the outbound calls for the agents show “Ring” state, and be stuck there, with no CID shown, and they will keep trying to call til all 3 of their concurrent call limit is used and then it just locks like that and those calls remain stuck in “Ring”
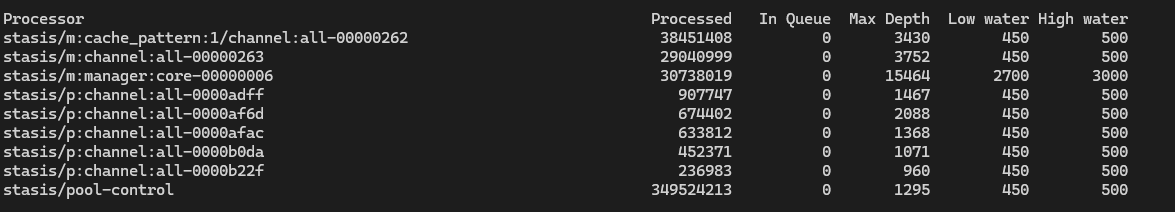
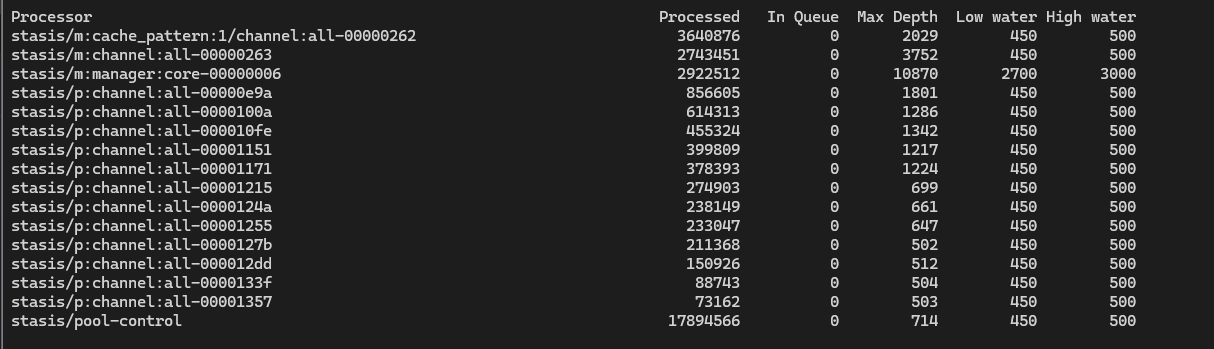
This is how it looks all the time, generally we’ll see Max Depths of 1600+ across p:channel:all with 10+ processors for this:
The Warnings:
[2024-04-26 13:56:32] WARNING[29477][C-00000e8e]: taskprocessor.c:1225 taskprocessor_push: The 'stasis/m:manager:core-00000006' task processor queue reached 3000 scheduled tasks again.
[2024-04-26 13:56:32] WARNING[29474][C-00000e8e]: taskprocessor.c:1225 taskprocessor_push: The 'stasis/p:channel:all-0000247f' task processor queue reached 500 scheduled tasks again.
[2024-04-26 13:56:32] WARNING[29477][C-00000e8e]: taskprocessor.c:1225 taskprocessor_push: The 'stasis/p:channel:all-00001e9d' task processor queue reached 500 scheduled tasks again.
    --     -- LazyMembers debugging - Numbusies: 0, Nummems: 26
    --     -- LazyMembers debugging - Numbusies: 0, Nummems: 8
    --     -- LazyMembers debugging - Numbusies: 0, Nummems: 8
    --     -- LazyMembers debugging - Numbusies: 0, Nummems: 20
    --     -- LazyMembers debugging - Numbusies: 0, Nummems: 8
    --     -- LazyMembers debugging - Numbusies: 0, Nummems: 8
    --     -- LazyMembers debugging - Numbusies: 0, Nummems: 8
    --     -- LazyMembers debugging - Numbusies: 0, Nummems: 8
Machine Stats:
16 Cores, 32 GB RAM, SSD Storage (Hosted on Azure, F16s v2)
FreePBX 16.0.40.7
Asterisk 16.30.0
CPU/Memory Averages @ 1min never peak 20% on PBX or DB
Output of - top -p pidof asterisk -n 1 -H -b: top output - FreePBX Pastebin
We use an external MySQL database however it is local to the PBX with < 1ms latency to the PBX, under minimal load at all times and is scaled well over requirements.
The only realtime that we use is for queuelog and we have about 6 queues, with basic configurations.
Call Detail Record (CDR) settings
----------------------------------
  Logging:                    Enabled
  Mode:                       Simple
  Log calls by default:       Yes
  Log unanswered calls:       No
  Log congestion:             No

  Ignore bridging changes:    No

  Ignore dial state changes:  No

* Registered Backends
  -------------------
    cdr_manager
    Adaptive ODBC

ODBC DSN Settings
-----------------

  Name:   asterisk-phonemanager
  DSN:    MySQL-asterisk-phonemanager
    Number of active connections: 3 (out of 25)
    Logging: Disabled

  Name:   asteriskcdrdb
  DSN:    MySQL-asteriskcdrdb
    Number of active connections: 4 (out of 5)
    Logging: Disabled
Our stasis.conf:
[threadpool]
;
; For a busy 8 core PBX, these settings are probably safe.
;
initial_size = 20
idle_timeout_sec = 20
;
; The notes about the pjsip max size apply here as well.  Increasing to 100 threads is probably
; safe, but anything more will probably cause the same thrashing and memory over-utilization,
max_size = 100
Our pjsip_custom.conf: (currently, we’ve tried adjusting this up and down with no affect)
[system]
type=system
;
;  <other settings>
;

; Sets the threadpool size at startup.
; Setting this higher can help Asterisk get through high startup loads
; such as when large numbers of phones are attempting to re-register or
; re-subscribe.
threadpool_initial_size=50

; When more threads are needed, how many should be created?
; Adding 5 at a time is probably safe.
threadpool_auto_increment=5

; Destroy idle threads after this timeout.
; Idle threads do have a memory overhead but it's slight as is the overhead of starting a new thread.
; However, starting and stopping threads frequently can cause memory fragmentation.  If the call volume
; is fairly consistent, this parameter is less important since threads will tend to get continuous
; activity.  In "spikey" situations, setting the timeout higher will decrease the probability
; of fragmentation.  Don't obsess over this setting.  Setting it to 2 minutes is probably safe
; for all PBX usage patterns.
threadpool_idle_timeout=120

; Set the maximum size of the pool.
; This is the most important settings.  Setting it too low will slow the transaction rate possibly
; causing timeouts on clients.  Setting it too high will use more memory, increase the chances of
; deadlocks and possibly cause other resources such as CPU and I/O to become exhausted.
; For a busy 8 core PBX, 100 is probably safe.  Setting this to 0 will allow the pool to grow
; as high as the system will allow.  This is probably not what you want. :)  Setting it to 500
; is also probably not what you want.  With that many threads, Asterisk will be thrashing and
; attempting to use more memory than can be allocated to a 32-bit process.  If memory starts
; increasing, lowering this value might actually help.
threadpool_max_size=100
We have ran this system, generally unchanged for 3 years on a VM half the size, then last Thursday it just started locking up, and I cannot find a source…
What I’ve tried:
- Migrating the system to a new physical host
- Scaling the VM Size (it ran on a VM half this size for the last 3 years)
- Migrating the DB to a new physical host
- Scaling the DB Size
- Adjusting the threadpools for stasis/pjsip up and down
- Optimizing the database tables, purging old records in the cdr
- Logical dump and restore of entire db to completely new setup
Please if someone can offer a new place to look, this is crushing our business ![]()