I’m looking at moving some stuff off an old ESXi server to possibly a KVM based solution (Proxmox currently). The last virtual machine I’m looking at is FreePBX. The current VM is an older x86 install. So in the process of moving it to the latest release, I’ve installed the latest ISO as a new KVM based virtual machine. I’ve done nothing beyond install the ISO, login to the shell, install qemu-guest-agent (for qemu/KVM integration), and then watch htop/top/free commands. I haven’t even opened the webpage yet. The VM has been like this for 3 days.
The KVM VM was setup with 8 cores and 2GB of memory. The memory is set for a min of 2GB and ballooning IS enabled for the VM. From what I can tell Virtio drivers are installed and functional in the FreePBX distros.
I’m not the most well versed in Linux memory management but I’m concerned about a potential memory leak.The numbers reported seemed a bit odd to me.
Initially the memory usage from running “free -m”, “htop”, and “top” showed a consistent total of ~600MB after about 12 hours (started at <500MB but seemed to settle here). The top process was “letschat” at ~6%. The Proxmox UI showed similar memory usage but a bit higher.
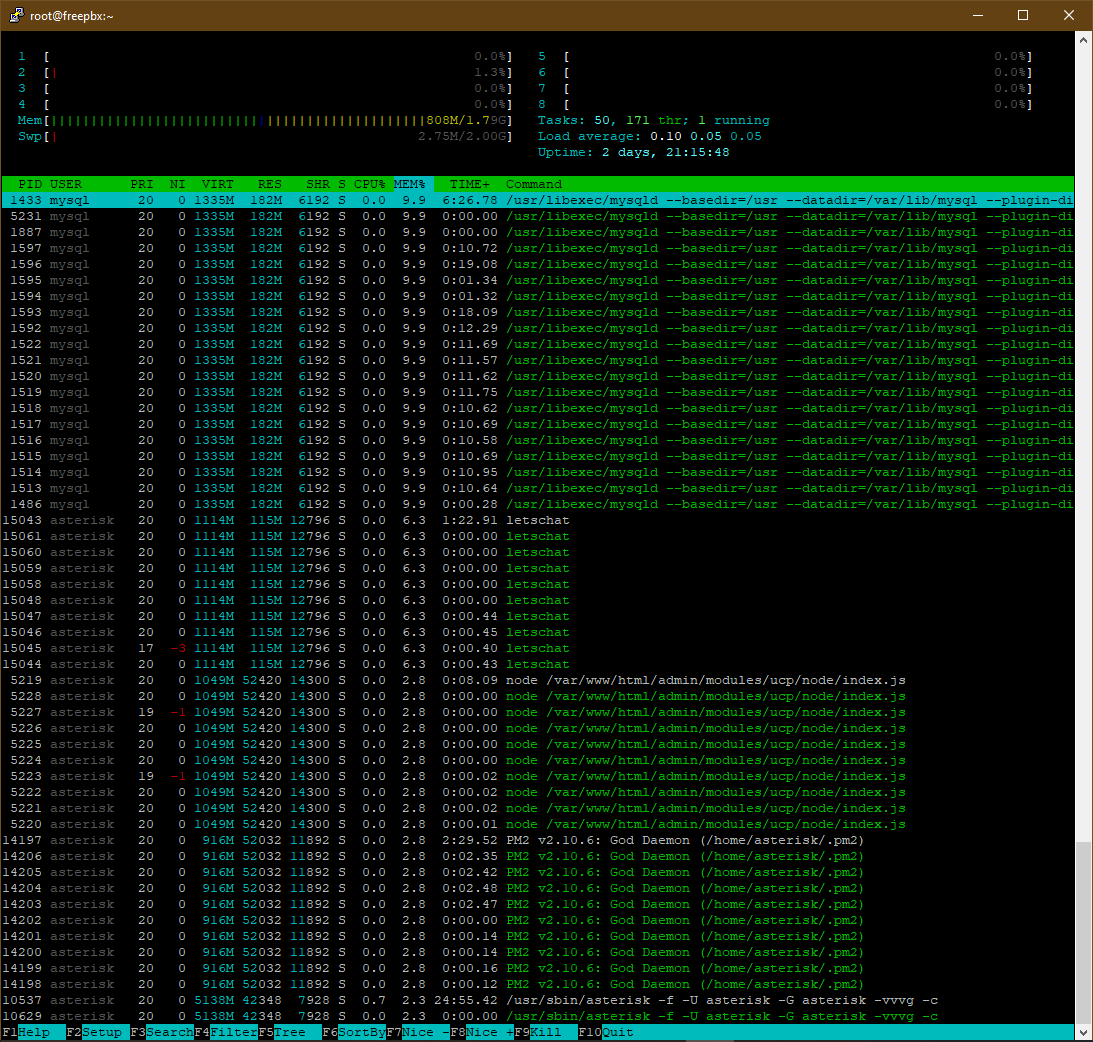
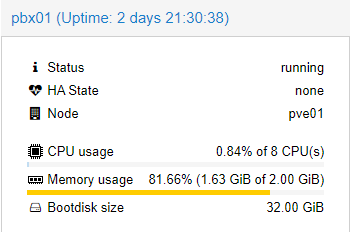
Now after 3 days of just sitting it appears mysqld (mariadb) is using the most memory at ~10%. The other processes seem to be pretty consistent in their memory usage otherwise. htop is reporting >800MB but free and top look like they are reporting 600MB. Finally Proxmox is showing 1.65GiB of 2GiB memory usage (82%).
What I “think” might be going on here is that the “used” memory reported by each of these methods is handled differently, probably around buffer/cache or similar. My thinking is htop is including some allocated memory that top and free aren’t in it’s “USED” amount. And qemu-guest-agent is pulling the 1.63GiB usage based on something similar (looking at free I’m guessing used+buff/cache).
[root@freepbx ~]# free -m
              total        used        free      shared  buff/cache   available
Mem:           1836         620         153         101        1062         780
Swap:          2047           2        2045

[root@freepbx ~]# top
Tasks: 173 total,   1 running, 172 sleeping,   0 stopped,   0 zombie
%Cpu(s):  0.0 us,  0.0 sy,  0.0 ni, 99.9 id,  0.0 wa,  0.0 hi,  0.0 si,  0.0 st
KiB Mem :  1880892 total,   155364 free,   637312 used,  1088216 buff/cache
KiB Swap:  2097148 total,  2094332 free,     2816 used.   796884 avail Mem

  PID USER      PR  NI    VIRT    RES    SHR S  %CPU %MEM     TIME+ COMMAND
 1433 mysql     20   0 1367620 186628   6192 S   0.7  9.9   6:26.57 mysqld
15043 asterisk  20   0 1140808 117260  12796 S   0.0  6.2   1:22.84 letschat
14197 asterisk  20   0  938980  52296  11892 S   0.0  2.8   2:29.39 PM2 v2.10.6: Go
 5219 asterisk  20   0 1074676  52144  14300 S   0.0  2.8   0:08.05 node /var/www/h
10537 asterisk  20   0 5261872  42348   7928 S   0.3  2.3  24:54.43 asterisk
 1152 mongodb   20   0  482852  38712   2756 S   0.3  2.1  12:56.75 mongod
14207 asterisk  20   0  983568  31248  11780 S   0.0  1.7   0:50.22 node /var/www/h
 1042 root      20   0  624656  26932  17020 S   0.0  1.4   0:09.90 httpd
 1028 root      20   0  573920  17692   4492 S   0.0  0.9   0:16.79 tuned
13715 root      20   0 1231056  12124   2424 S   0.0  0.6   2:47.22 fail2ban-server
  734 polkitd   20   0  612228  12080   2488 S   0.0  0.6   0:25.75 polkitd
  330 asterisk  20   0  624656  11360   1440 S   0.0  0.6   0:00.44 httpd
  331 asterisk  20   0  624656  11360   1440 S   0.0  0.6   0:00.00 httpd
  332 asterisk  20   0  624656  11360   1440 S   0.0  0.6   0:00.00 httpd
  333 asterisk  20   0  624656  11360   1440 S   0.0  0.6   0:00.00 httpd
  334 asterisk  20   0  624656  11360   1440 S   0.0  0.6   0:00.00 httpd
 2594 asterisk  20   0  197980   8380   3888 S   0.0  0.4   0:00.06 pnp_server
 1038 redis     20   0  142956   6664   1164 S   0.0  0.4   2:24.41 redis-server
 9983 root      20   0  157392   6336   4876 S   0.0  0.3   0:00.07 sshd
 1034 root      20   0  306520   5496   3132 S   0.0  0.3   0:24.43 rsyslogd
 6055 postfix   20   0   89756   3988   2992 S   0.0  0.2   0:00.01 pickup
 1024 root      20   0  112864   3840   2816 S   0.0  0.2   0:00.01 sshd
 1630 postfix   20   0   89824   3700   2696 S   0.0  0.2   0:00.27 qmgr
    1 root      20   0   43952   3544   2084 S   0.0  0.2   0:57.07 systemd
  969 root      20   0  107464   2612    624 S   0.0  0.1   0:00.01 dhclient
  565 root      20   0   40232   2528   2300 S   0.0  0.1   0:30.81 systemd-journal
 1084 root      20   0   99272   2520   1748 S   0.0  0.1   0:00.04 login
10106 root      20   0  182388   2480   1512 S   0.0  0.1   0:00.00 crond
10075 root      20   0  162024   2328   1540 R   0.3  0.1   0:00.11 top
  747 dbus      20   0   58236   2124   1480 S   0.0  0.1   1:02.81 dbus-daemon
 1625 root      20   0   89652   2044   1008 S   0.0  0.1   0:01.22 master
 9985 root      20   0  115440   1972   1564 S   0.0  0.1   0:00.01 bash
  743 avahi     20   0   60192   1960   1500 S   0.0  0.1   0:12.76 avahi-daemon
  735 root      20   0   24844   1948   1636 S   0.0  0.1   1:42.23 qemu-ga
12315 root      20   0  115436   1920   1492 S   0.0  0.1   0:00.14 bash
  754 chrony    20   0  117784   1676   1212 S   0.0  0.1   0:00.38 chronyd
  772 root      20   0   26376   1600   1252 S   0.0  0.1   0:35.61 systemd-logind
 1065 root      20   0  126312   1600    924 S   0.0  0.1   0:06.22 crond
 1136 mysql     20   0  113308   1556   1264 S   0.0  0.1   0:00.02 mysqld_safe
 1027 nobody    20   0   53884   1548   1164 S   0.0  0.1   0:00.00 dnsmasq
  592 root      20   0   44796   1440    924 S   0.0  0.1   0:00.09 systemd-udevd
13718 root      20   0   14468   1404   1124 S   0.0  0.1   0:07.51 gam_server
  748 root      20   0   15032   1204    916 S   0.0  0.1   0:00.00 incrond
  741 root      20   0   21664   1196    936 S   0.0  0.1   0:12.42 irqbalance
10110 asterisk  20   0  113176   1168    996 S   0.0  0.1   0:00.00 sh
  738 rpc       20   0   69264   1140    604 S   0.0  0.1   0:00.59 rpcbind
  588 root      20   0  198556   1024    740 S   0.0  0.1   0:00.01 lvmetad
  710 root      16  -4   55520   1024    584 S   0.0  0.1   0:09.49 auditd
 1060 root      20   0   25904    908    708 S   0.0  0.0   0:00.00 atd
 1032 root      20   0   27164    856    604 S   0.0  0.0   0:00.00 xinetd
10535 root      20   0  115300    788    536 S   0.0  0.0   0:00.00 safe_asterisk
  756 avahi     20   0   60060    376      0 S   0.0  0.0   0:00.00 avahi-daemon
10113 asterisk  20   0  107952    356    280 S   0.0  0.0   0:00.00 sleep
    2 root      20   0       0      0      0 S   0.0  0.0   0:00.11 kthreadd
    3 root      20   0       0      0      0 S   0.0  0.0   0:00.21 ksoftirqd/0
    5 root       0 -20       0      0      0 S   0.0  0.0   0:00.00 kworker/0:0H
Anyone have opinions or insights?
I’m hoping others can speak to it. I’d hate to move the VM and end up creating a problem.