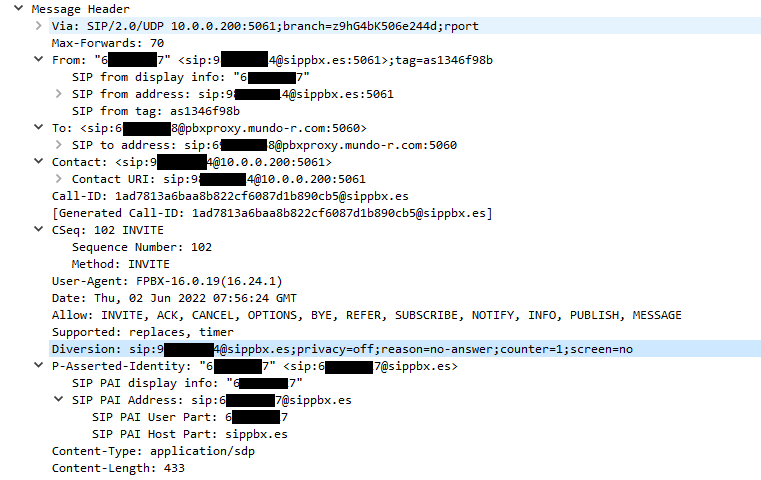
Any ideas how to get such detailed PJSIP logs as in this picture:
Equivalent output is produced in /var/log/asterisk/full, if it is enabled for verbose output, after issuing the Asterisk CLI command “pjsip set logger on”. This setting is not persistent across restarts. This would be the preferred method for complete traces, as it is the one that most people are used to reading.
The actual output, you are showing looks like it comes from wireshark, either directly, or using a pcap file. pcap files an be produced using the Linux tcpdump command.
sngrep can also produce traces, but, I think, only displays one message at a time, in full detail.
Thanks, how to make “pjsip set logger on” verbose so as to watch it directly in the CLI?
You don’t want to do that because while it will log the information it will not log it in a way you can see it or pull it clearly. Other logging will happening which could result in the headers having other logging between them.
If you want to capture this type of traffic I suggest looking at res_hep+sipcapture or sngrep+sipcapture that can capture the traffic and give you pcaps, etc to review. If you use sipcapture you can have that displayed in a GUI to look at SIP packet history.
I wouldn’t log to the console, because that typically results in logs that lack time stamps, and which are often incomplete, because of limited scroll back in the terminal.
However, I’d generally prefer to see coordinated dialplan and protocol logging, even if the protocol logging sometimes get broken up by other messages.
This topic was automatically closed 31 days after the last reply. New replies are no longer allowed.