Hello everyone,
Though I would share this with everyone for two reasons:
- I have been searching for this solution for a while so gave up and made it myself.
- I am by no means an expert in anything so it’s always good for some feedback.
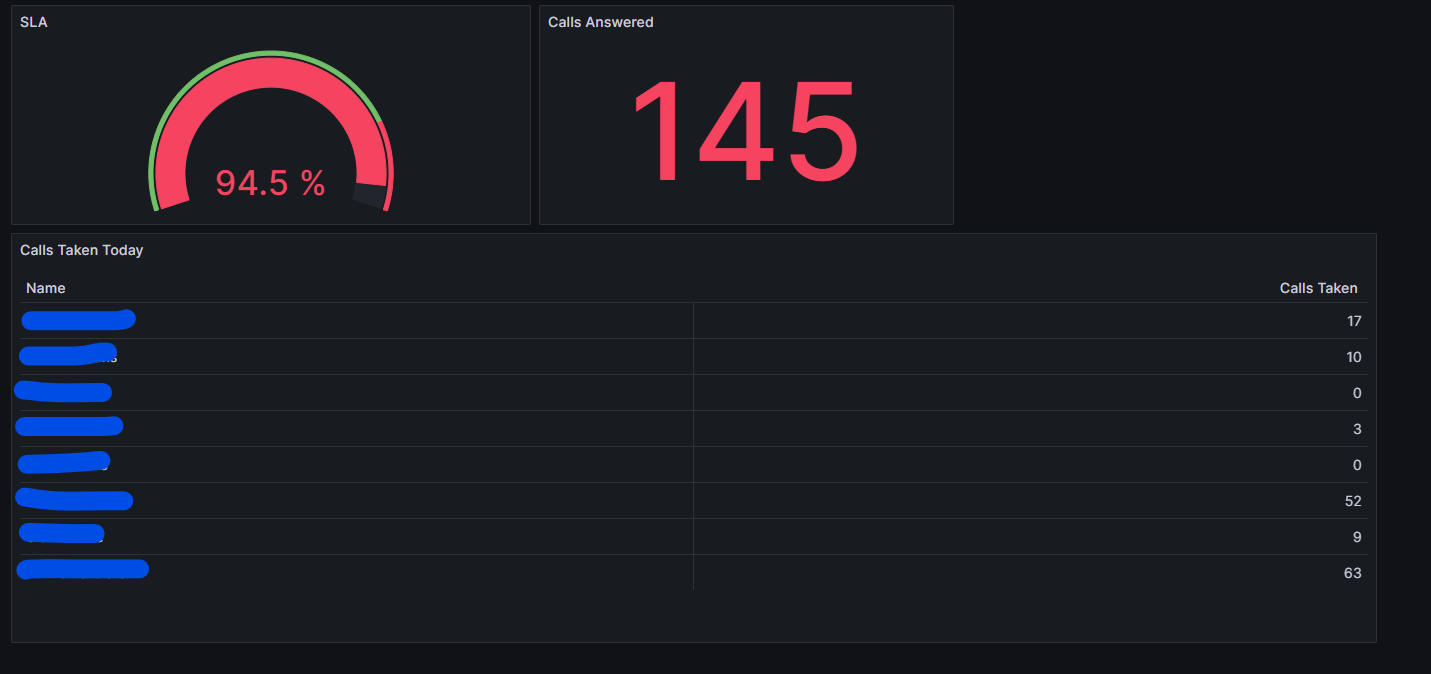
I have been able to show queue statistics with Grafana without having to use Grafana cloud (as this has an Asterisk integration built into it). See the dashboard below (names hidden):
For those who are interested and looking to do similar, here’s the rundown on how it works.
I have added the following PHP script to /var/www/html and named it stats.php:
<?php
$exten = shell_exec("asterisk -x 'queue show 123'");

$lines = explode("\n", trim($exten));
$queueInfoLine = array_shift($lines); // First line is queue info
$members = [];
$queueInfo = [];

// Remove ANSI escape codes from queue info line for cleaner text
$cleanQueueInfoLine = preg_replace('/\e[[][A-Za-z0-9];?]*m/', '', $queueInfoLine);

// Define a regex pattern to extract queue info
$queueInfoPattern = '/(\d+) calls.*?(\d+s) holdtime, (\d+s) talktime.*?W:(\d+), C:(\d+), A:(\d+), SL:(\d+\.\d+)%, SL2:(\d+\.\d+)%/';

if (preg_match($queueInfoPattern, $cleanQueueInfoLine, $queueMatches)) {
    $queueInfo = [
        'Calls' => (int)$queueMatches[1],
        'HoldTime' => $queueMatches[2],
        'TalkTime' => $queueMatches[3],
        'W' => (int)$queueMatches[4],
        'Answered' => (int)$queueMatches[5],
        'Unanswered' => (int)$queueMatches[6],
        'SL' => (float)$queueMatches[7],
        'SL2' => (float)$queueMatches[8]
    ];
}

foreach ($lines as $line) {
    // Remove ANSI escape codes for cleaner text
    $cleanLine = preg_replace('/\e[[][A-Za-z0-9];?]*m/', '', $line);

    if (strpos($cleanLine, "Members:") === false && !empty($cleanLine)) {
        // Define a regex pattern to extract member name and calls taken
        $pattern = '/(.*?) \(.*\).* has taken (\d+|no) calls/';

        if (preg_match($pattern, $cleanLine, $matches)) {
            $memberName = trim($matches[1]); // Extract member name
            $callsTaken = $matches[2] === 'no' ? 0 : (int)$matches[2]; // Convert 'no' to 0, else to int

            $members[] = [
                'Name' => $memberName,
                'CallsTaken' => $callsTaken,
            ];
        }
    }
}

$result = [
    'QueueInfo' => $queueInfo,
    'Members' => $members
];

$jsonOutput = json_encode($result, JSON_PRETTY_PRINT);
header('Content-Type: application/json');
echo $jsonOutput;
?>
This is taking the CLI data from the command asterisk -x ‘queue show 123’ and sifting through the data and then outputting it in JSON format.
{
    "QueueInfo": {
        "Calls": 0,
        "HoldTime": "9s",
        "TalkTime": "173s",
        "W": 0,
        "Answered": 145,
        "Unanswered": 13,
        "SL": 94.5,
        "SL2": 90.5
    },
    "Members": [
        {
            "Name": "HIDDEN NAME",
            "CallsTaken": 17
        },
        {
            "Name": "HIDDEN NAME",
            "CallsTaken": 10
        },
        {
            "Name": "HIDDEN NAME",
            "CallsTaken": 0
        },
        {
            "Name": "HIDDEN NAME",
            "CallsTaken": 3
        },
        {
            "Name": "HIDDEN NAME",
            "CallsTaken": 0
        },
        {
            "Name": "HIDDEN NAME",
            "CallsTaken": 52
        },
        {
            "Name": "HIDDEN NAME",
            "CallsTaken": 9
        },
        {
            "Name": "HIDDEN NAME",
            "CallsTaken": 63
        }
    ]
}
Now I have the JSON data available, I can then add this as a JSON data source in Grafana allowing me to show this data in real-time on the big screen.
Any suggestions for improvements are greatly appreciated!