I have installed FreePBX version 16.0.14 using Asterisk version “16.16.1~dfsg-1+deb11u1”; no upgrade, just a plain vanilla installation running since 2 weeks.
Though when opening the FreePBX web interface using either the Edge or the Firefox browser the displet is always empty.
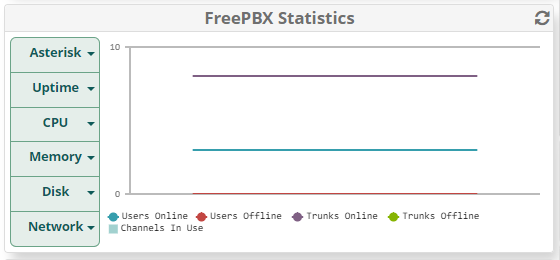
I select for example the “CPU-Week” category, which shows as depicted below an empty statistics displet window:
Full info would be cool… looks like you are using some derivative of debian. There is a chance you are missing a library or a command is different. This stuff is tested on the SNG7 which is an EL derivative. A lot of things do “just work” in debian because there is a strong presence of debian users in the community including those that use builds on the raspi.
Nothing wild, have done this many times in the past in conjunction with previous versions of FreePBX and Asterisk under Debian 9 Stretch.
I do not see any problems with the Asterisk installation itself.
For me it is merely a problem with the web representation of statistics gathered and (lack of displaying) on the respective displet window of the FreePBX application.
I’ve seen a lot of my FreePBX15 and 16 distro systems show the same behavior. Some time later (hours or a day) after the system has been running a while the data will start to appear. System reboots will cause the “hour” stats to be blank again sometimes…
It always fixed itself after a period of time so I never really bothered complaining about it.
Thank you for the pointer: I have toggled the switch for the “Settings / Advanced Settings / Dashboard Module / Disable collection of system statistics” twice back to “No” and am getting now the statistics as depicted with: