Concurrency Count 2.3.0 is ready for wider testing and feedback. It promises nothing more at this stage.
It has been tested in normal use and throughout its development, but this is currently unsigned and hasn’t been put under heavy load, and community testing will undoubtedly uncover things I have missed. Please exercise particular caution with very large Historical Reports and Demo.
Once considered stable, it will graduate from my personal @kierknoby development space to @freepbxUK, and it will be published as a signed community module.
Concurrency Count 2 (concurrencycount) is a new community module for FreePBX/PBXact 16 and 17 that helps administrators understand how much simultaneous calling activity their PBX is actually handling, both live and historically.

 DO NOT attempt to install this on FreePBX 15 or below, please. It is versions 16 and 17 only. PJSIP is required. Historical Reports require Asterisk CDR to be enabled, with call records stored in
 asteriskcdrdb. Normal reporting does not write to source CDR data; only the optional Demo feature temporarily creates tagged synthetic CDR records.
Concurrency Count started life as a standalone Bash script because of a very practical problem: finding out how many calls a PBX was actually handling at the same time should not require guesswork or spreadsheets.
The original tool could look back through CDR data and calculate historical concurrency for trunks, extensions and the PBX overall. Concurrency Count 2 takes that considerably further and puts it inside FreePBX as a proper module.
In practical terms, it helps answer questions such as:
- How many PJSIP trunk legs are active right now?
- What was the highest simultaneous trunk usage last month?
- When did that peak occur, and which calls contributed to it?
- Are particular extensions regularly handling overlapping calls?
- How much extension-side activity was happening across the PBX at its busiest point?
- Is current trunk usage approaching a level where an administrator should be alerted?
There are three main areas: Live View, Live Wall and Historical Reports.
Live View
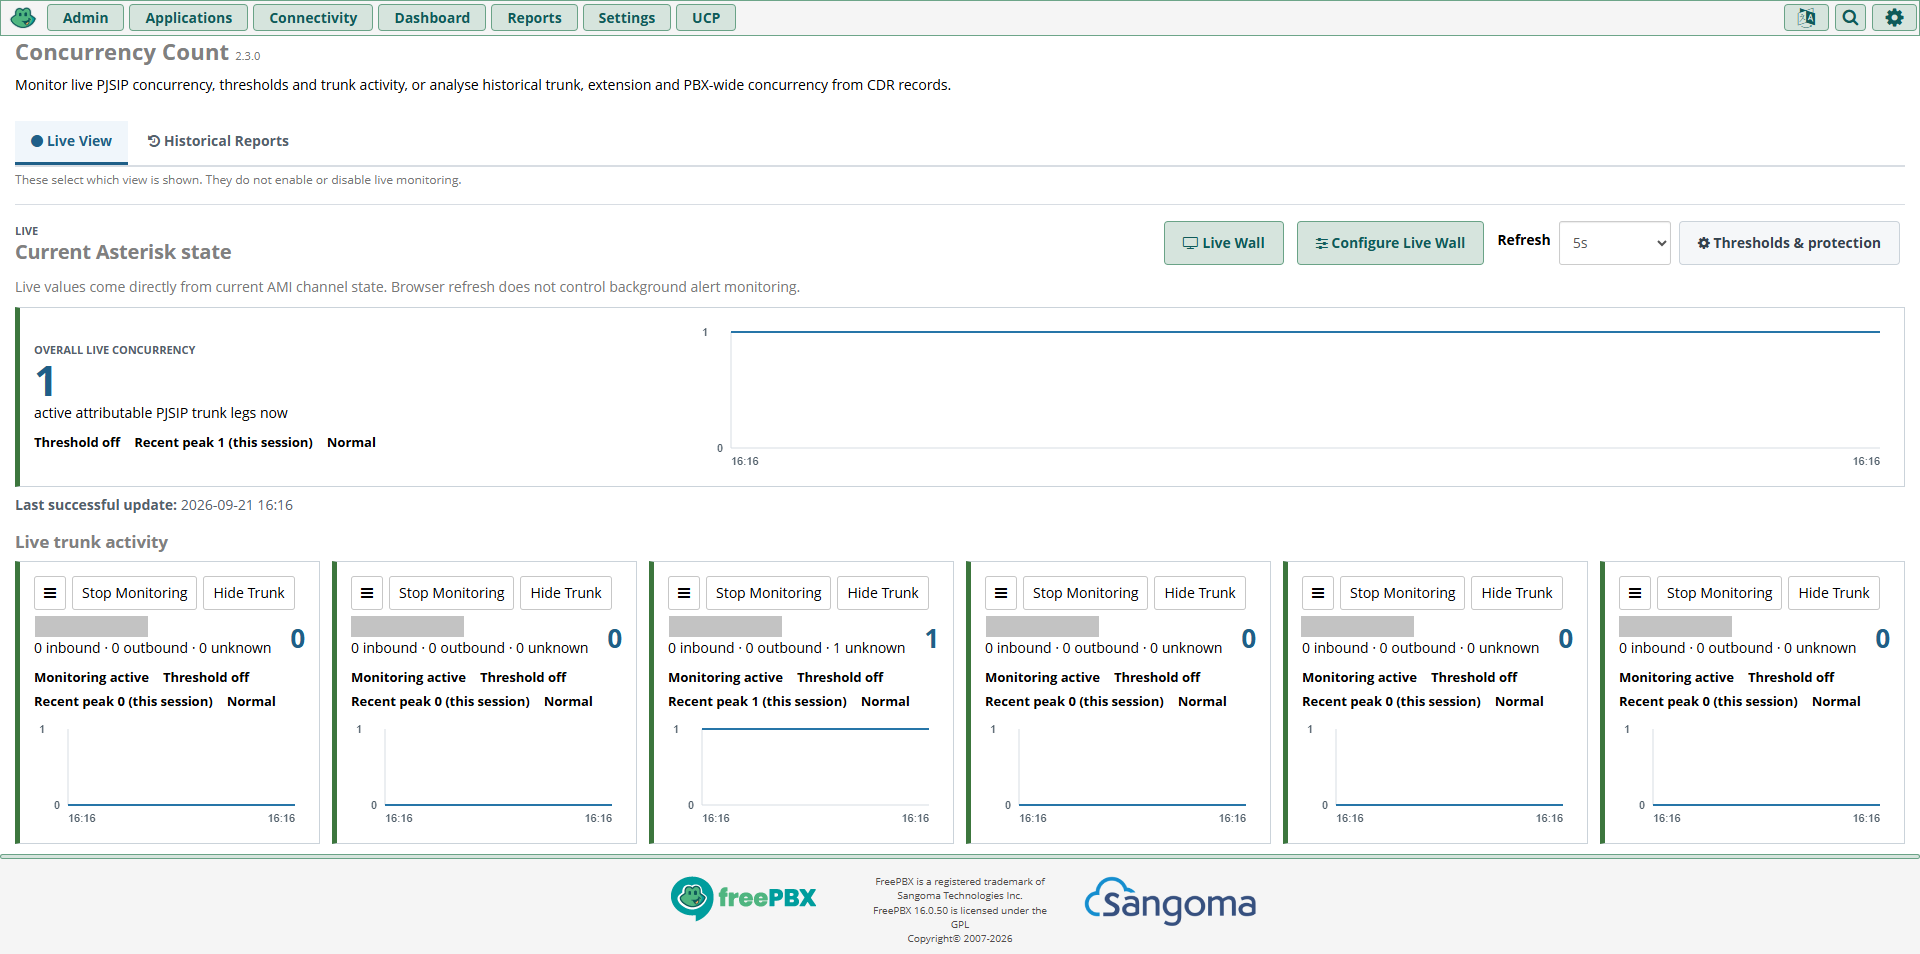
Live View shows current attributable PJSIP trunk-leg concurrency from Asterisk, with individual trunk counts and Overall Live Concurrency.
Overall Live Concurrency deliberately counts attributable PJSIP trunk legs, rather than complete calls or conversations. An ordinary inbound or outbound external call contributes one trunk leg, a hairpin call can contribute two, and an internal extension-to-extension call contributes none.
Thresholds can be configured for Overall and individual trunks, with unattended email alerts when a threshold is reached and optional recovery notifications when usage falls back below it.
The monitoring and mail workers continue independently of the browser, so closing Live View does not stop unattended threshold monitoring or alert delivery. Live Settings also includes a Test email function using the same delivery path as production alerts.
Trunks can be reordered, hidden from the main view, or removed from unattended monitoring without changing the underlying SIP configuration. Live View also shows a recent browser-session peak and supports refresh intervals from 1 to 60 seconds.
Live Wall
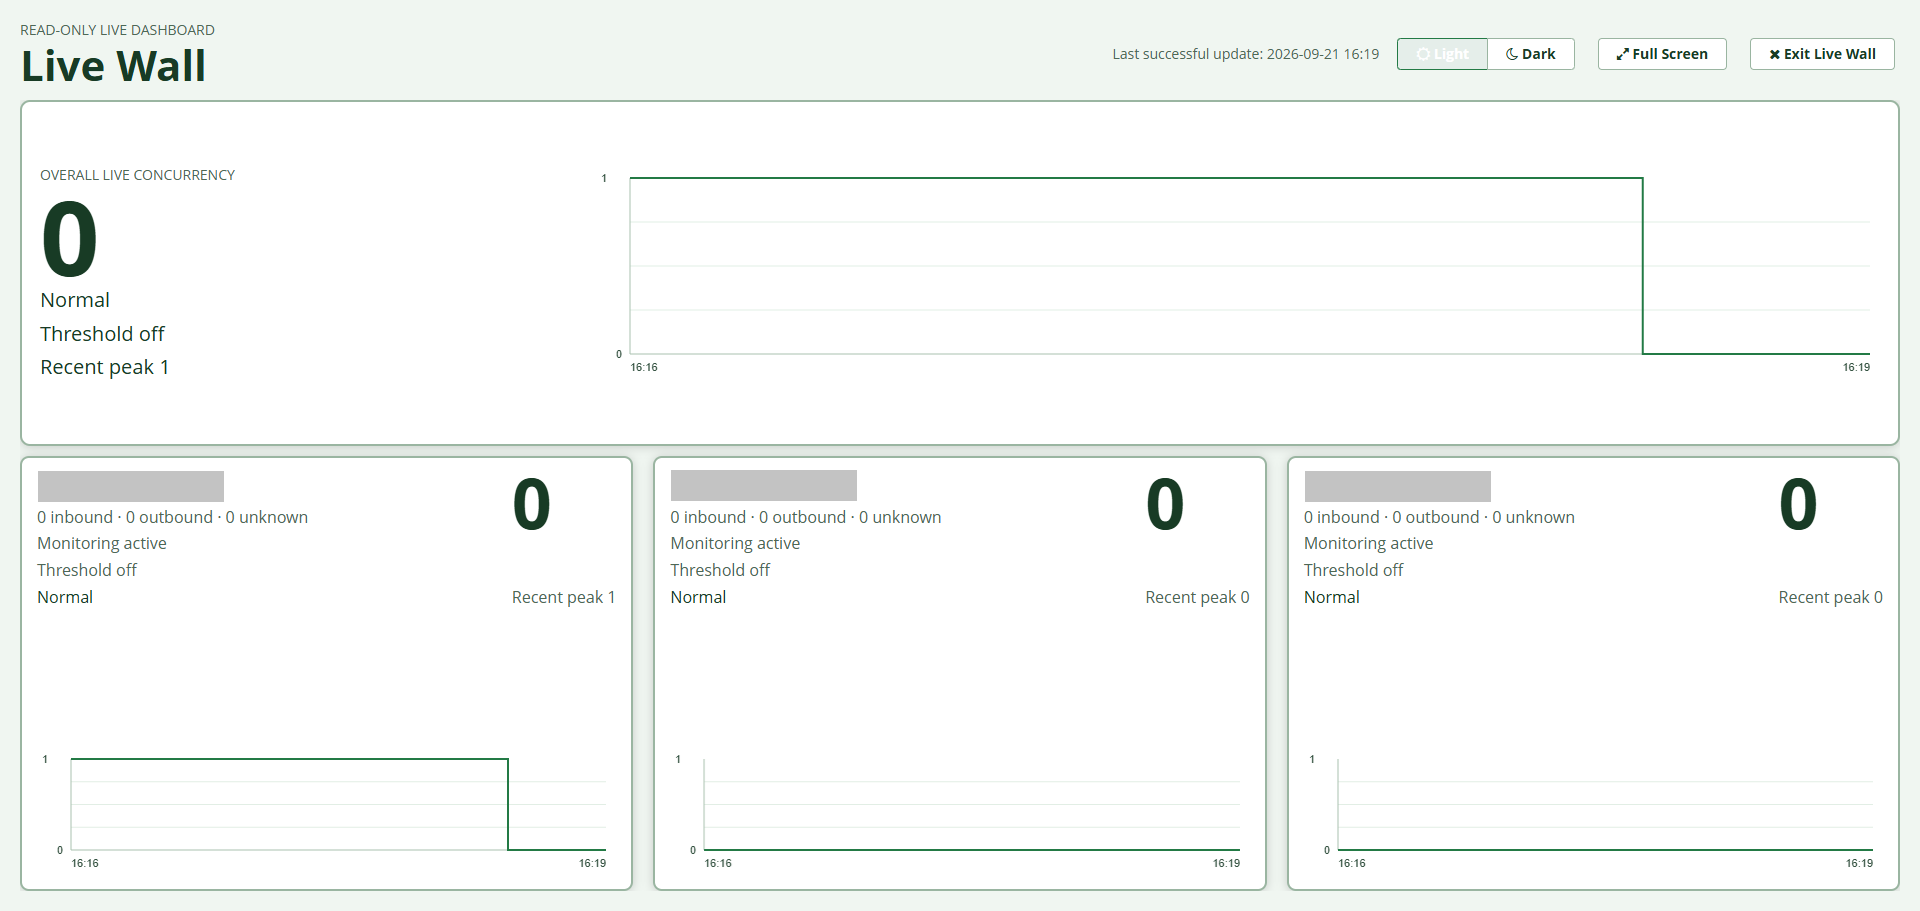
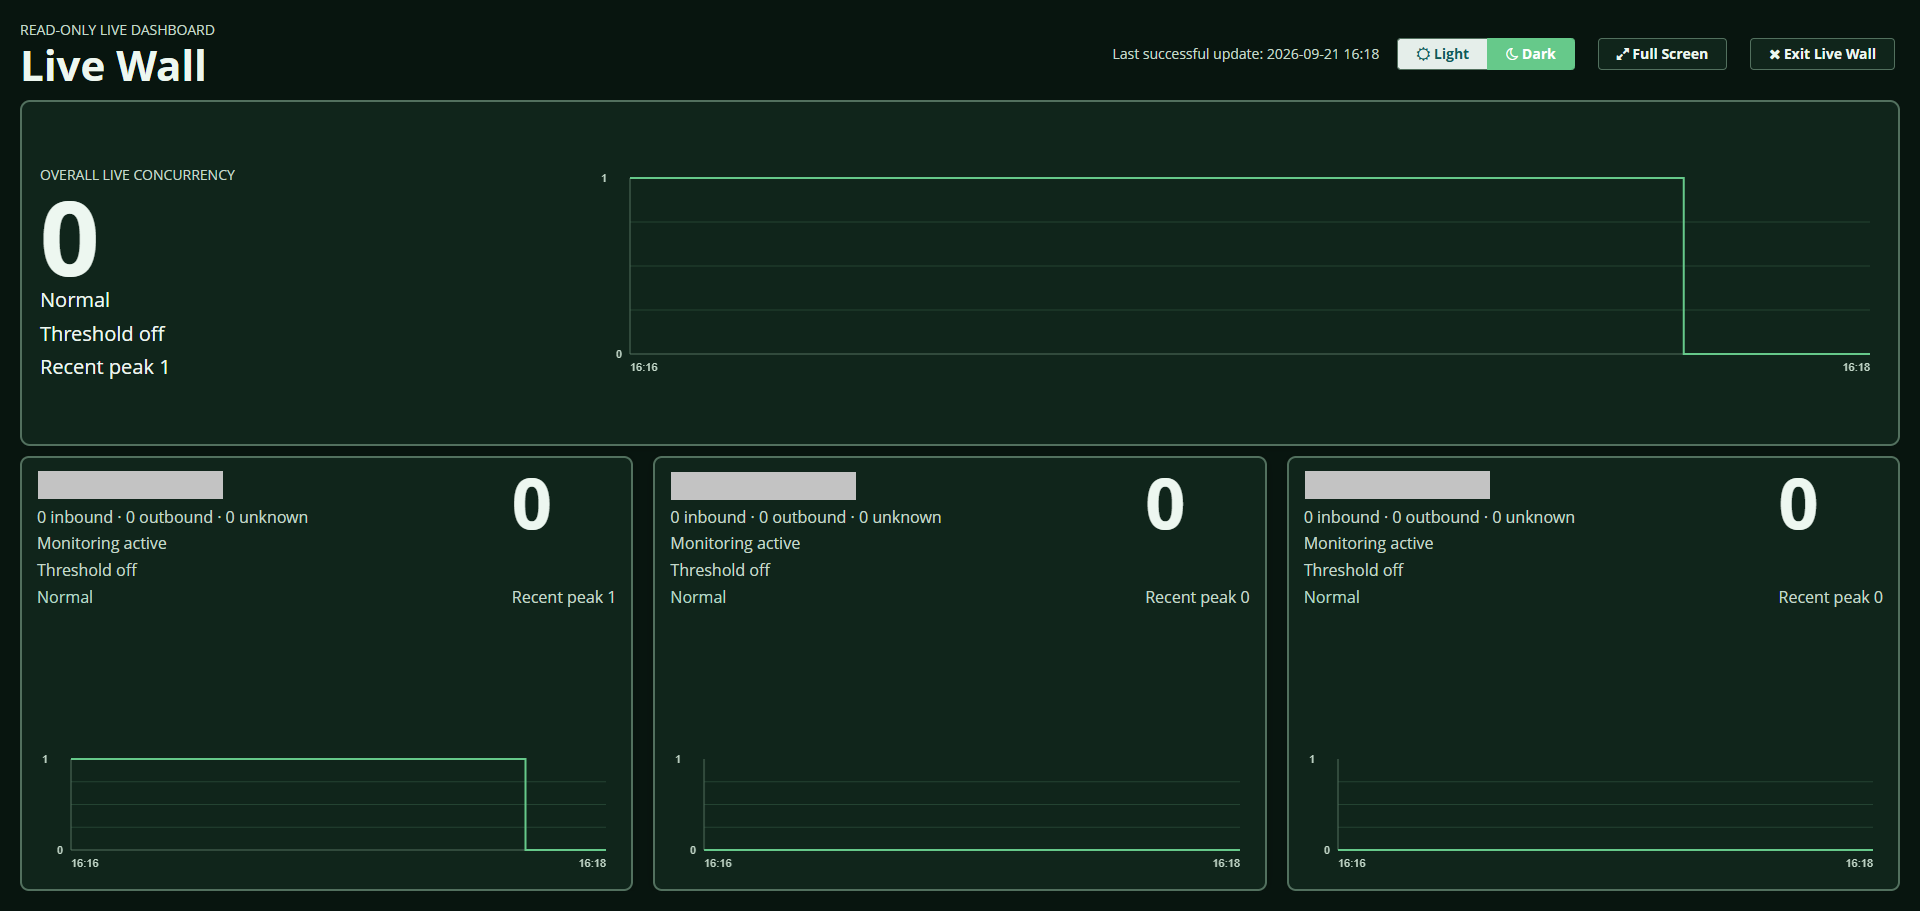
Live Wall is a read-only presentation of the same live data for wallboards and monitoring displays. It can run windowed or browser-fullscreen, has Light and Dark presentation, and keeps Overall Live Concurrency in the primary position alongside selected trunks.
Historical Reports
Historical Reports reconstruct past concurrency from answered Asterisk CDR data and provide three different measurements:
• Trunk Concurrency measures simultaneous external PJSIP trunk legs.
• Extension Concurrency measures overlapping answered CDRs assigned to individual extensions.
• Group Concurrency measures PBX-wide simultaneous extension-side activity.
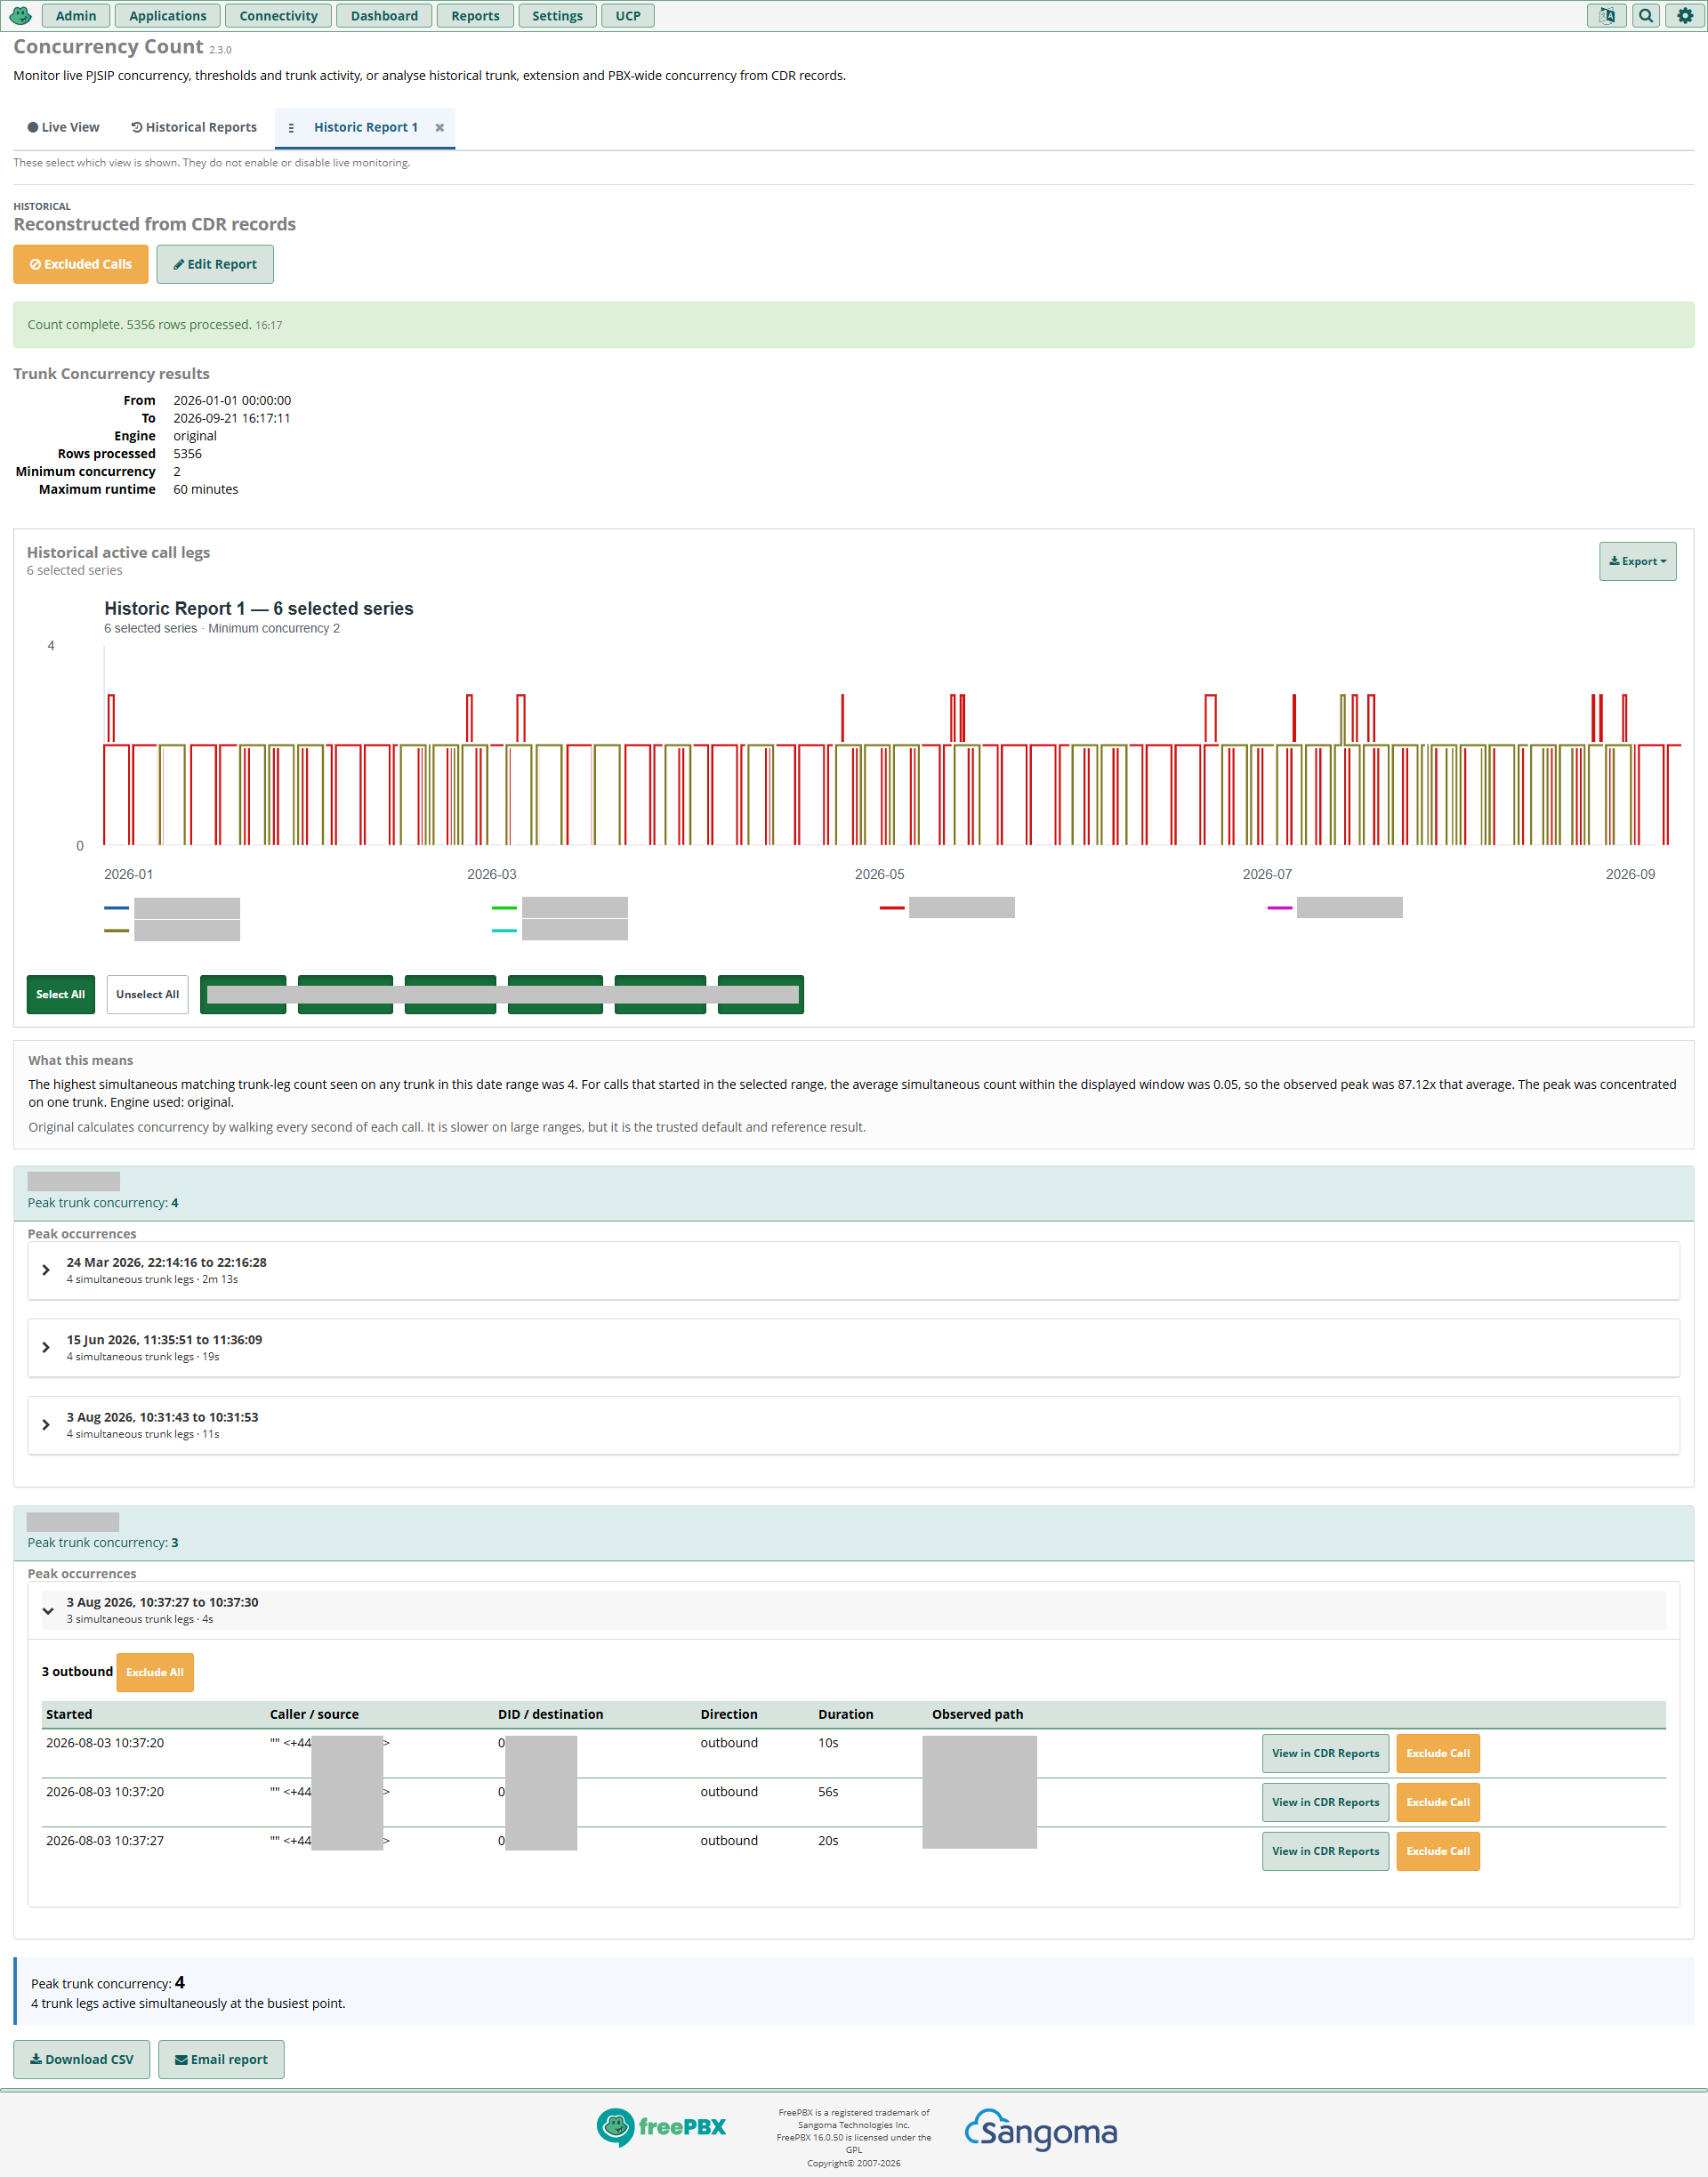
Historical reporting uses ANSWERED CDRs with a recorded duration greater than zero. A calculated peak of 1 is shown as Activity only rather than concurrency, which begins at 2.
Up to five Historic Reports can be kept as persistent report tabs. Reports can be filtered by date and endpoint, moved through previous and next date ranges, graphed, downloaded as CSV or emailed.
Trunk results can be expanded to show exactly when a peak occurred and which calls made up that peak. Where possible, Concurrency Count also identifies the related destination and gives you a View in CDR Reports link to open the matching call in FreePBX.
Historical graphs let you choose which results to display and can be downloaded as SVG, PDF, PNG or JPEG.
Calls that should not form part of Historical reporting can also be excluded without changing or deleting the original CDR. Individual exclusions are reversible, and qualifying calls contributing to an exact displayed Trunk peak can also be excluded as a group.
Unknown or deleted PJSIP endpoint identities found in historical CDRs can be classified inside Concurrency Count without changing FreePBX, Asterisk or source CDR data.
Larger Historical Reports are deliberately treated with some caution. Concurrency Count monitors the calculation while it runs, provides progress, runtime and ETA information, and includes PBX Protection to assess sustained CPU, memory, swap, disk activity, and observed database-query pressure.
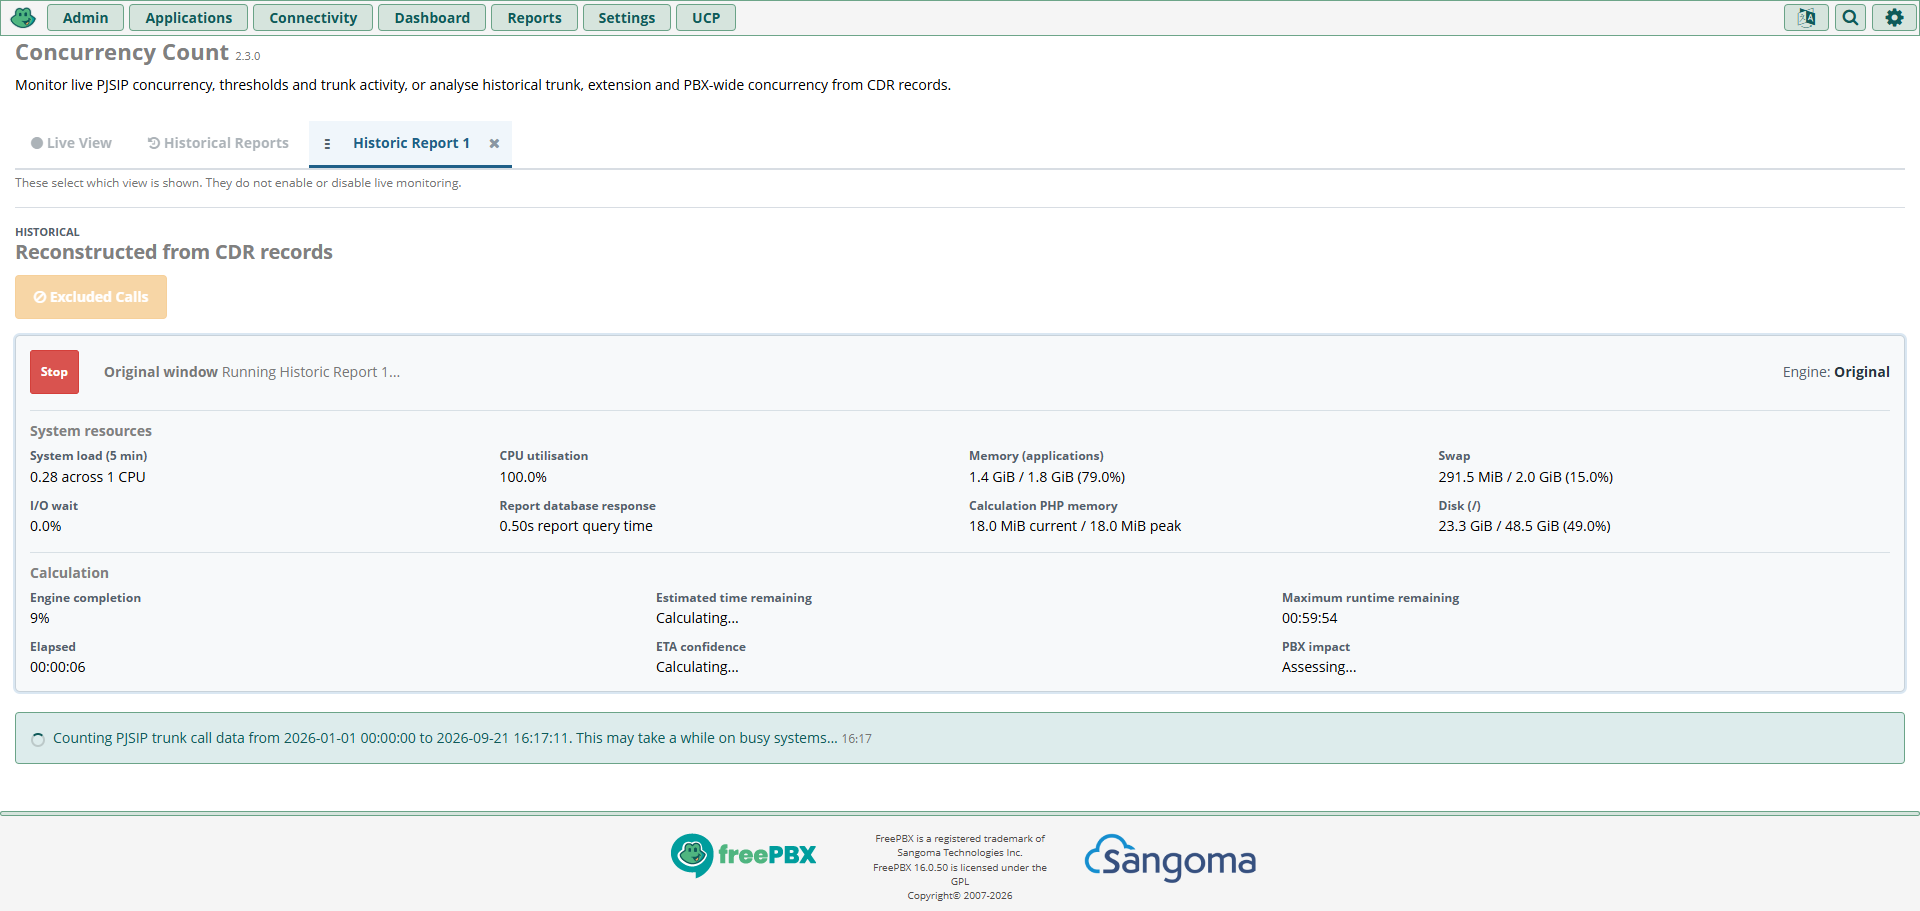
A concerning workload can be paused for an administrator decision rather than simply carrying on regardless. Calculations also have a configurable maximum runtime and a cooperative Stop control.
Reports support a minimum concurrency level, so you can choose not to fill the presentation with activity below the level you actually care about while still preserving the complete underlying calculation and actual peak.
Concurrency Count reports observed concurrency. It does not claim that a particular number of calls represents a fixed percentage of an Asterisk system’s capacity. Hardware, transcoding, recording, dialplan behaviour, other modules, upstream limits and plenty of other factors can affect what a particular PBX can actually support.
Demo
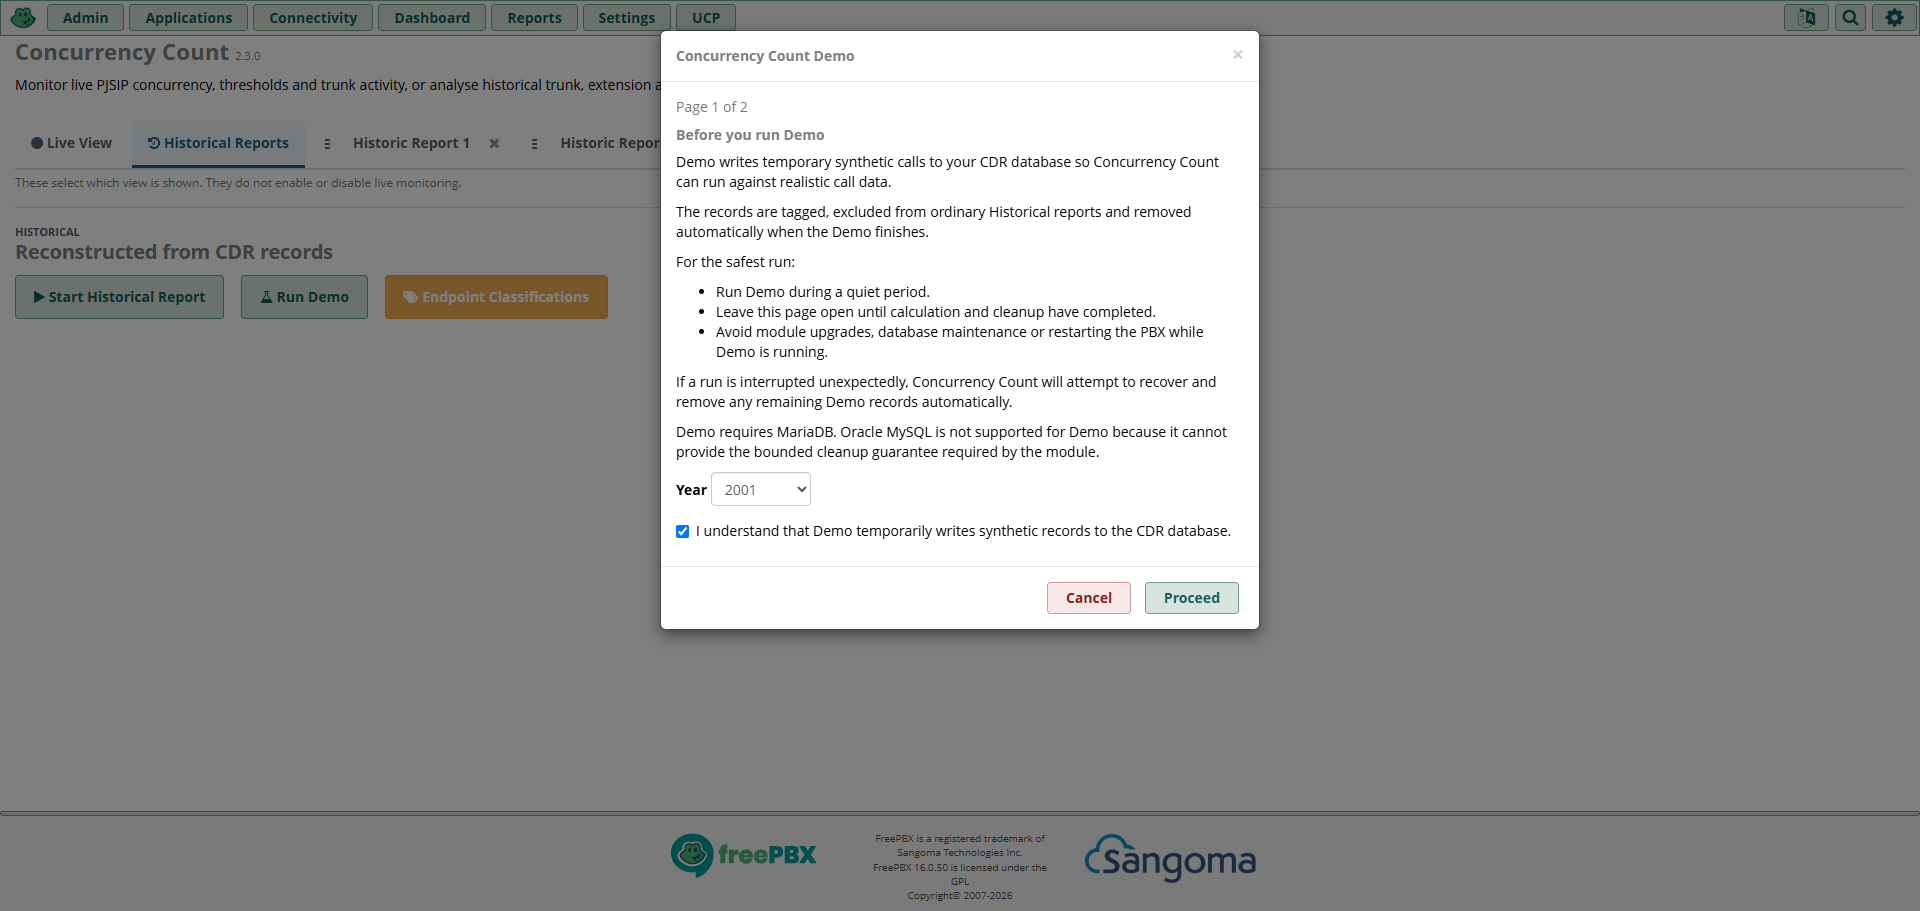
There is also a built-in Demo environment for testing the calculation engines and seeing how the module behaves without needing suitable real-world CDR activity.
Demo is deliberately disabled by default because it can temporarily write tagged synthetic CDR records into a database that normally contains genuine call records. To keep that test data well away from normal current CDR activity, Demo deliberately uses a selected year between 2001 and 2015. A privileged system administrator must explicitly authorise it from the CLI before the Demo can operate from within the GUI.
Enabling Demo access does not itself generate synthetic data, and normal Live monitoring, Historical reporting, thresholds and alerts do not require Demo.
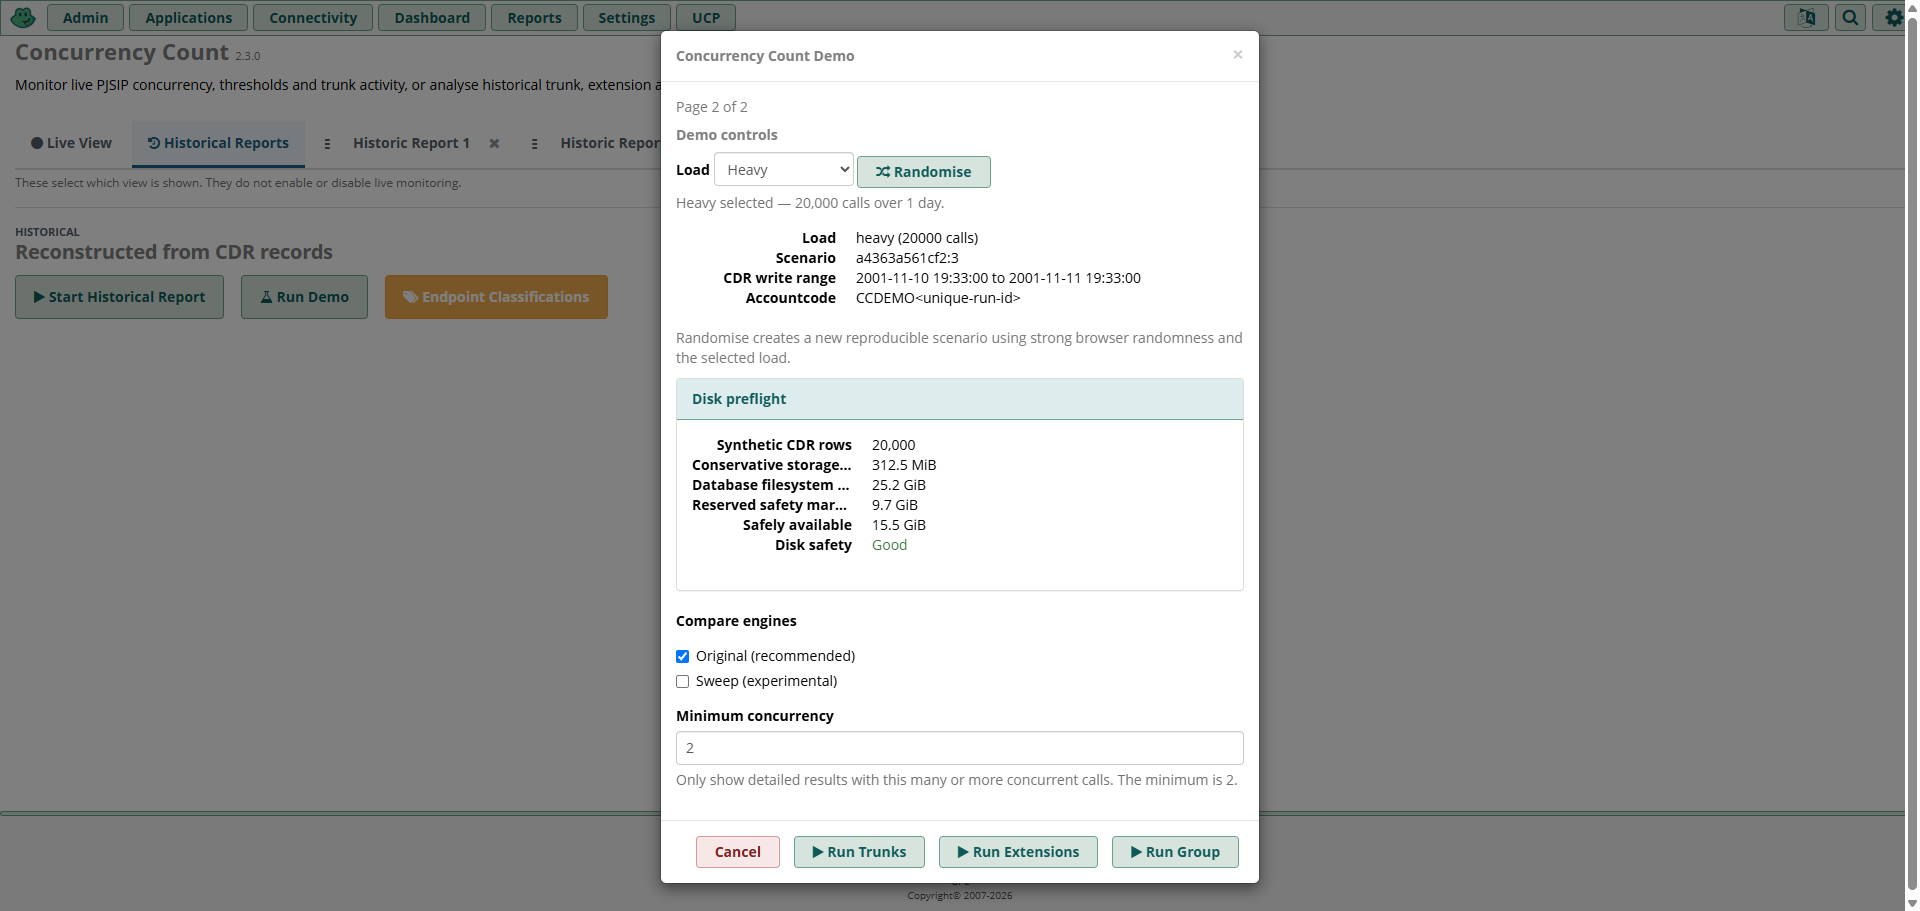
The Demo generates controlled PJSIP-only synthetic CDR scenarios using Light, Medium and Heavy profiles of 1,000, 5,000 and 20,000 calls over one day. It temporarily inserts the tagged records, compares the Original and experimental Sweep calculation engines against an independently calculated expectation, audits what was inserted and removed, and verifies cleanup afterwards.
It also applies the same progress, runtime and PBX Protection framework used by Historical Reports, so it can provide a capacity assessment of the Historical/CDR processing workload on that PBX. It does not test maximum simultaneous voice-call capacity.
Demo is there for deliberate testing, not normal operation.
Normal Concurrency Count reporting does not alter SIP configuration or source CDR records.
The main highlights in 2.3.0, the first publicly announced release, are:
- Live PJSIP trunk-leg concurrency with Overall and per-trunk views.
- Recent Live peak and selectable 1, 5, 10, 15, 30 and 60-second refresh.
- Persistent threshold monitoring that continues with the browser closed.
- Overall and per-trunk unattended email alerts.
- Optional recovery notifications.
- Test email using the same delivery path as production alerts.
- Full-screen or windowed Live Wall with Light and Dark presentation.
- Historical Trunk, Extension and Group concurrency.
- Activity-only presentation when the exact Historical peak is 1.
- Up to five persistent Historic Report tabs with reordering.
- Date presets, optional time boundaries and Previous/Next range movement.
- Exact peak occurrence detail for Trunks and contributing-call inspection.
- Related FreePBX destinations and View in CDR Reports links where available.
- Historical graphs with selectable results.
- SVG, PDF, PNG and JPEG graph export.
- CSV download and email output.
- Global reversible call exclusions, including grouped exclusion of calls contributing to an exact displayed Trunk peak.
- PJSIP Endpoint Classifications for unresolved historical identities.
- Minimum concurrency filtering without changing the underlying calculation.
- Configurable maximum Historical runtime.
- PBX Protection and calculation telemetry.
- Cooperative Stop and safe cancellation of Historical calculations.
- Original and experimental Sweep calculation engines.
- A controlled Demo and independent engine-comparison environment.
- Light, Medium and Heavy Demo profiles of 1,000, 5,000 and 20,000 synthetic calls.
- Shared GUI and
fwconsole concurrencycountcapabilities where applicable.
My GitHub repo contains everything you need to get started:
After reading the README, an easy way to install the module is by running the following as root.
FreePBX 16 / PBXact 16 (CentOS 7)
Check whether Git is installed:
rpm -q git
If Git is not installed:
yum install -y git
FreePBX 17 / PBXact 17 (Debian 12)
Check whether Git is installed:
dpkg -l git
If Git is not installed:
apt update
apt install -y git
Then run the following commands as root:
cd /var/www/html/admin/modules
git clone https://github.com/kierknoby/concurrencycount.git concurrencycount
cd ~
fwconsole ma install concurrencycount
fwconsole chown
fwconsole reload
The module will appear under Reports > Concurrency Count. Update instructions are in the README.
It’s open source and ad-free. I am looking forward to hearing your thoughts and discussing anything you find in wider testing. It does not pretend to be a finished product.
This was a fair bit of work and I will keep on improving it. The original Concurrency Count (concurrency-count) was a relatively simple Bash script, which I will also improve with lessons learned from the new module and maintain the tool as a lightweight alternative.
Concurrency Count 2 (concurrencycount) has become a considerably more complex module, particularly around Historical calculation safety, live monitoring, alerts, CDR handling, cancellation, Demo cleanup and making sure it fails safely when something isn’t right.
I am expecting to see edge cases and patch releases as it gets used against PBXs, CDRs and a range of workloads that I don’t realistically have access to. Please let me know your ideas too.
If you like the module, I would really appreciate a  on GitHub, as well as your comments and messages.
Thanks to those of you who have provided feedback already. Please keep it coming so we can make this something useful for everyone.
Cheers,
Kieran