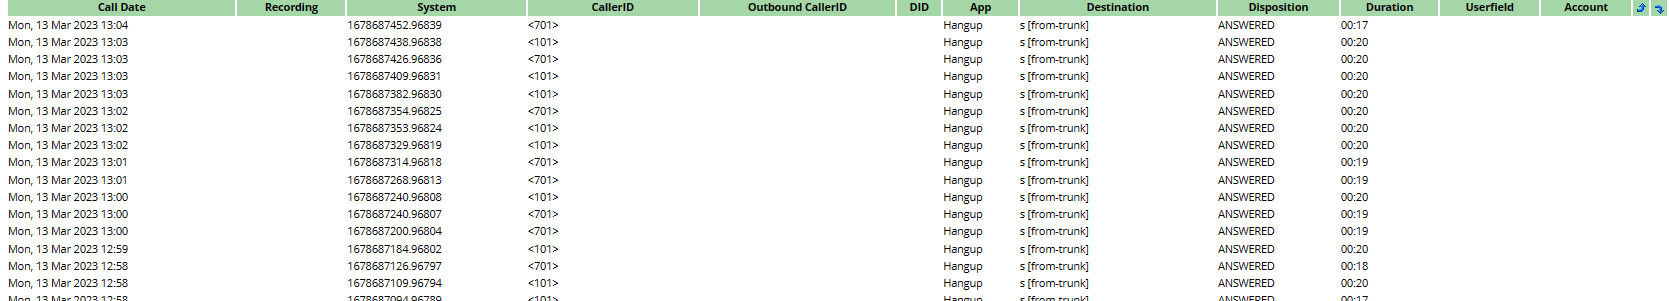
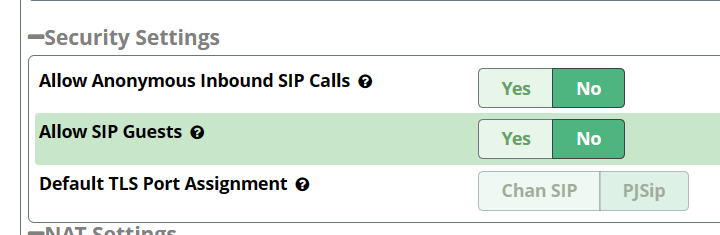
These appear to be attempted attacks, almost certainly from automated scanners. Because in Asterisk SIP Settings you have Allow Anonymous and Allow SIP Guests enabled, the calls were answered with a ‘not in service’ message played to the caller.
You should fix your regular incoming path so Anonymous and Guests are not needed, as well as blocking incoming SIP from unknown sources.
Could you please go into detail on how I can set blocking incoming SIP from unknown source or where can I fix the incoming path? are they needed to be set on sangoma PBX or customer’s network device?
Are you getting any valid incoming calls?
Whilst the caller IDs are suspicious for a provider, the destination is more consistent with a badly configured trunk than an attacker. An attacker would normally provide a premium rate number, whereas this is showing no number, which is more consistent with your not having configured for the way the provider sends DIDs.
Rather than my providing options based on various guesses, you should use the CLI command “pjsip set logger on”, and then provide the contents of the INVITE for one of these, from /var/log/asterisk/full.
The non empty fields will be the start time of the call, the internal unique name for the incoming channel at the end of the call, the caller ID name and number, the last dialplan action (hanging up the call), received digits (s is used to represent none) and the dialplan context used (this is the one for trunks), the general result of the call, and the length of the call in minutes and seconds.
This topic was automatically closed 30 days after the last reply. New replies are no longer allowed.