Running into a audio issue on one of our cloud pbx. This one is used alot, 3 different physical locations with sonicwall fwall at each. Connection is good, just getting choppy audio. Doesn’t affect all calls, can always hear it on MOH recordings. Looking at a ton of options, but can find anything other than whats below to see if problems exit.
Main thing: all 3 offices use same call queue. They suck at answering calls to. Call queue usually answers around 250 calls a day. About 20 phones in queue.
Are there resource constraints on the cloud PBX server itself? Looking at resource utilization would be a good idea I’m thinking if you have visibility into that area.
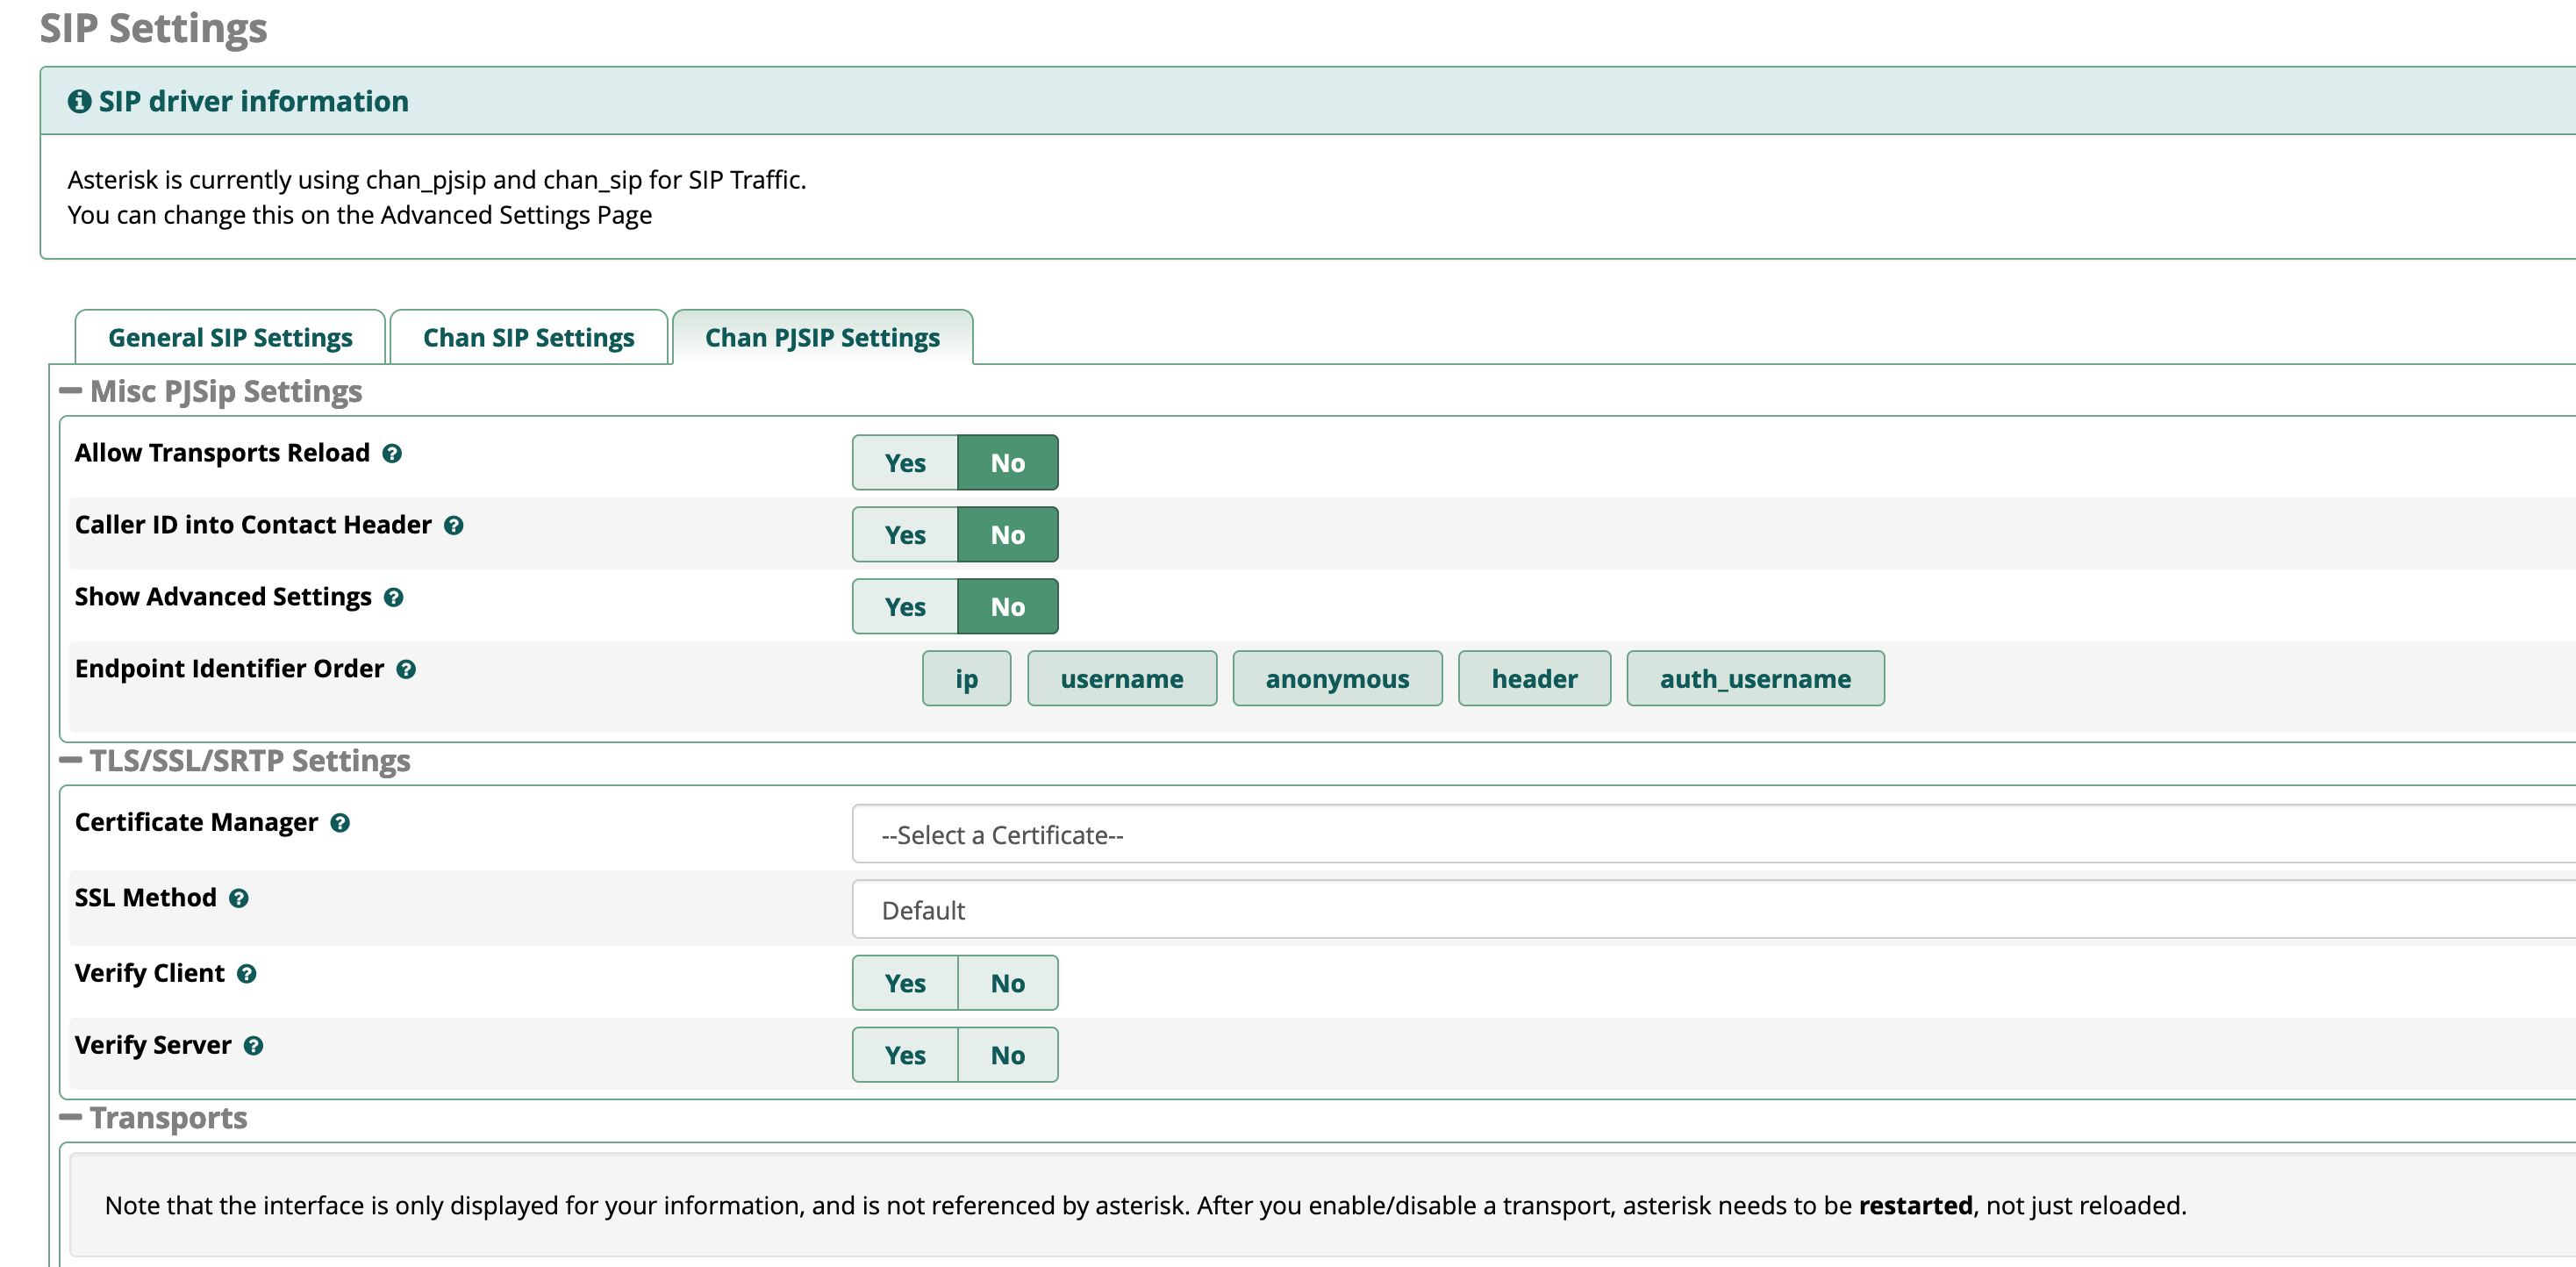
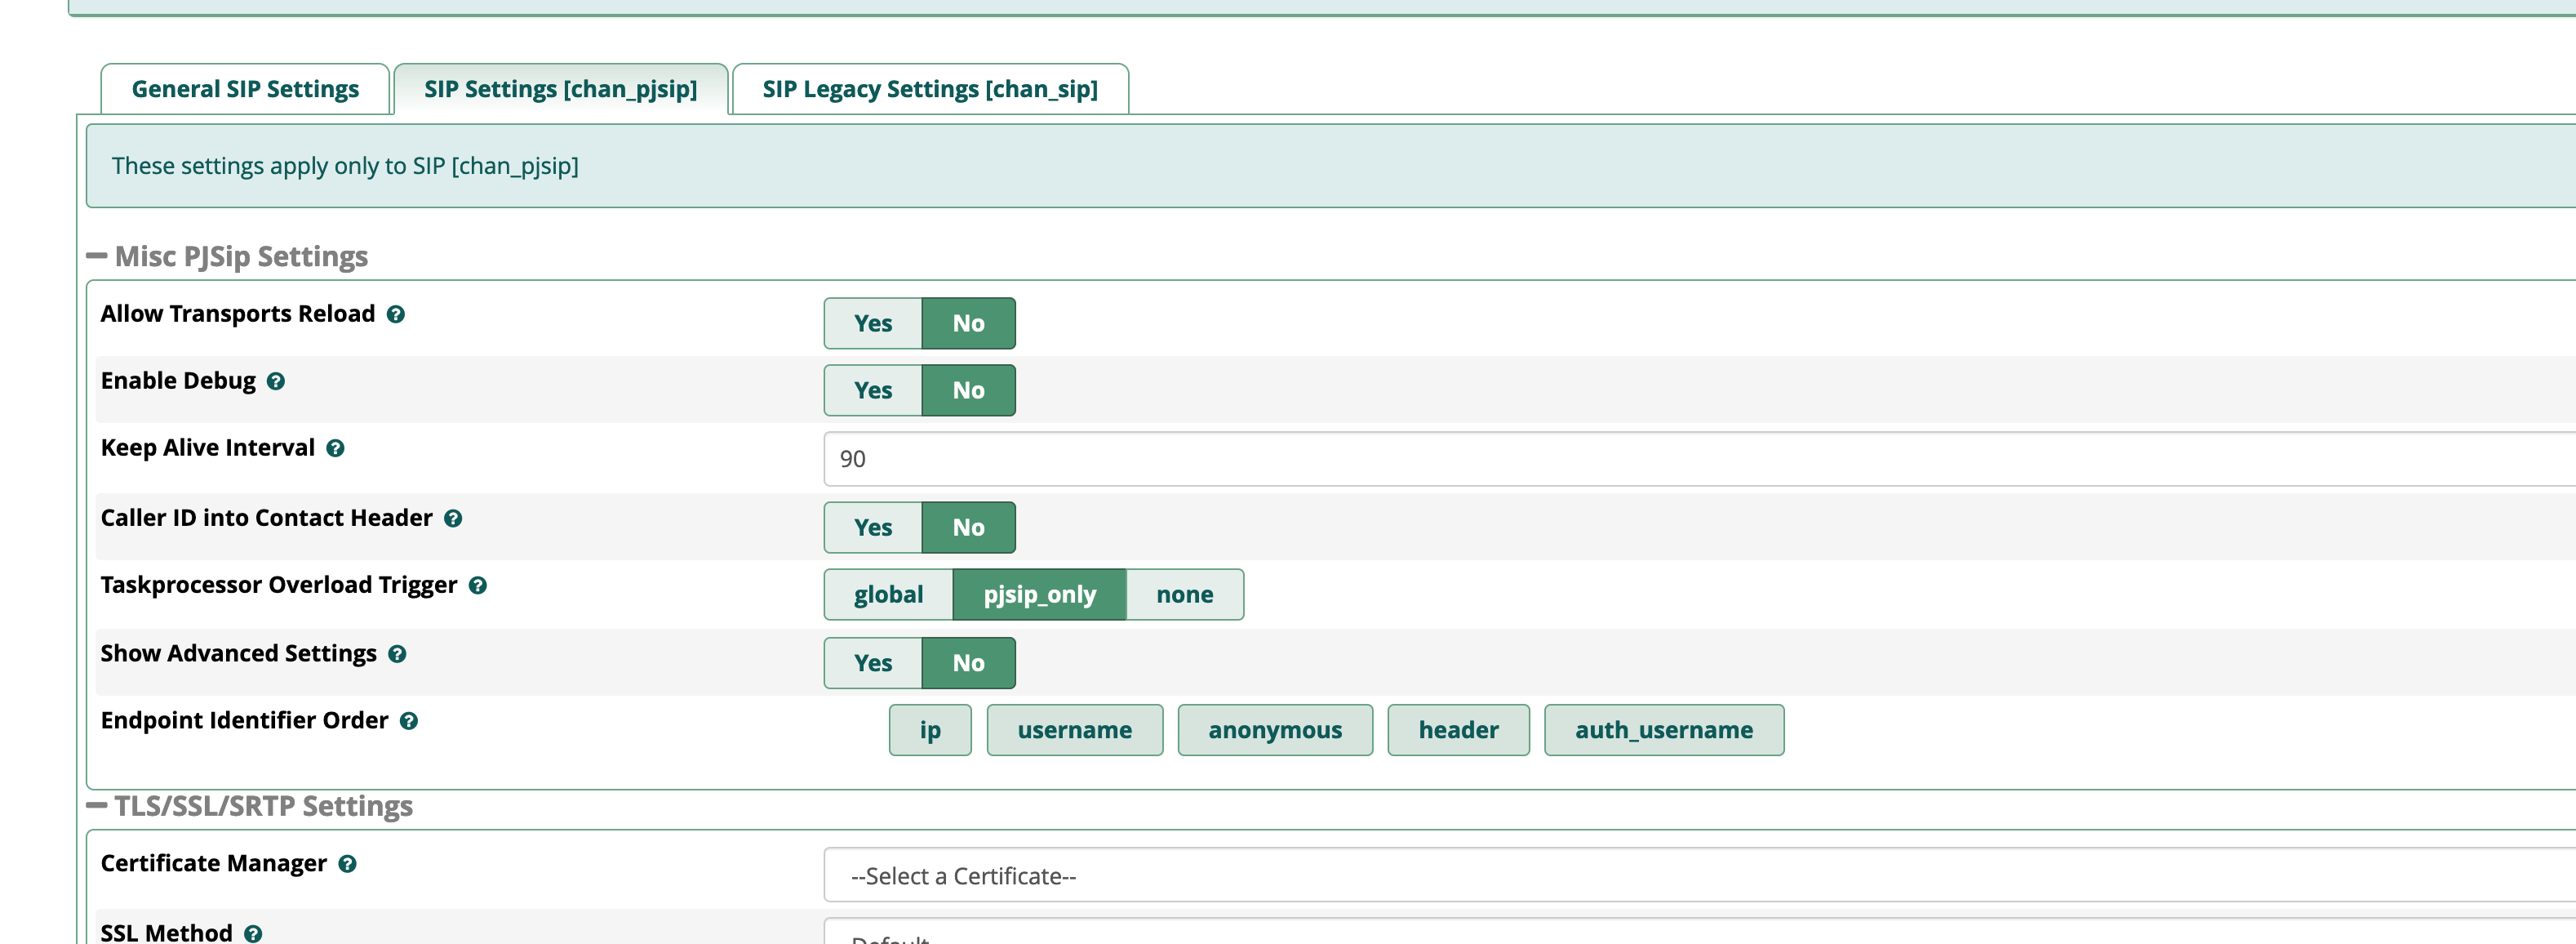
If the “Taskprocessor Overload Trigger” in Asterisk SIP Settings, PJSIP tab is set to global, you can try setting it to pjsip only, that might quite the taskprocessor log entries.
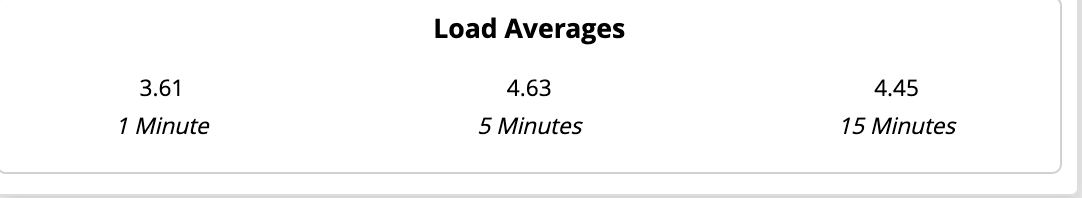
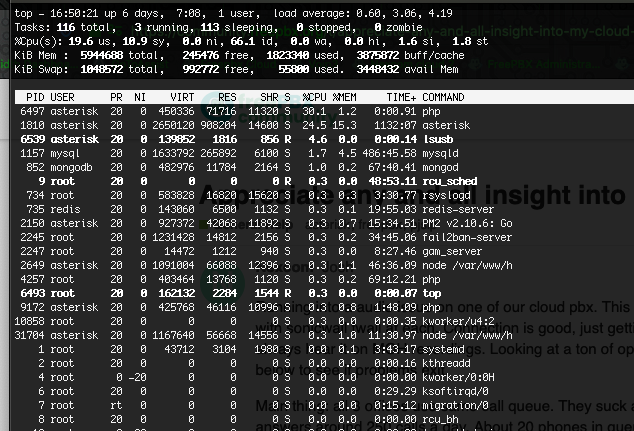
Told its dual processor with gigabit speed. Running top on asterisk it hits up to around 64% sometimes, but never sticks or goes much higher.
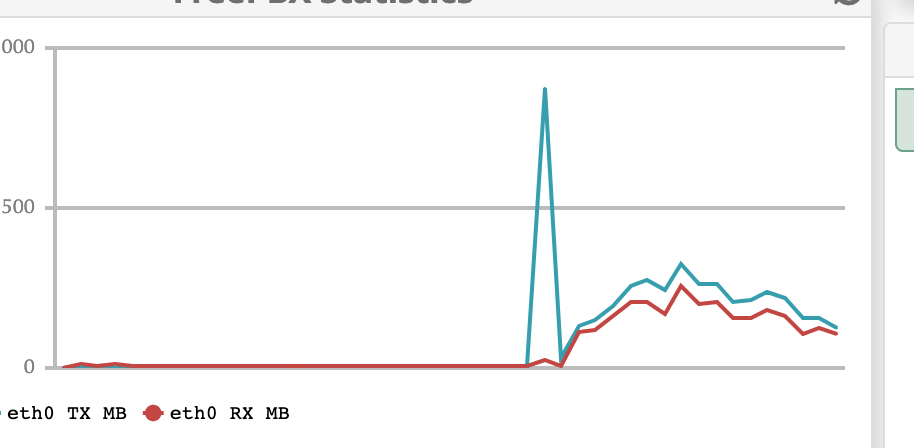
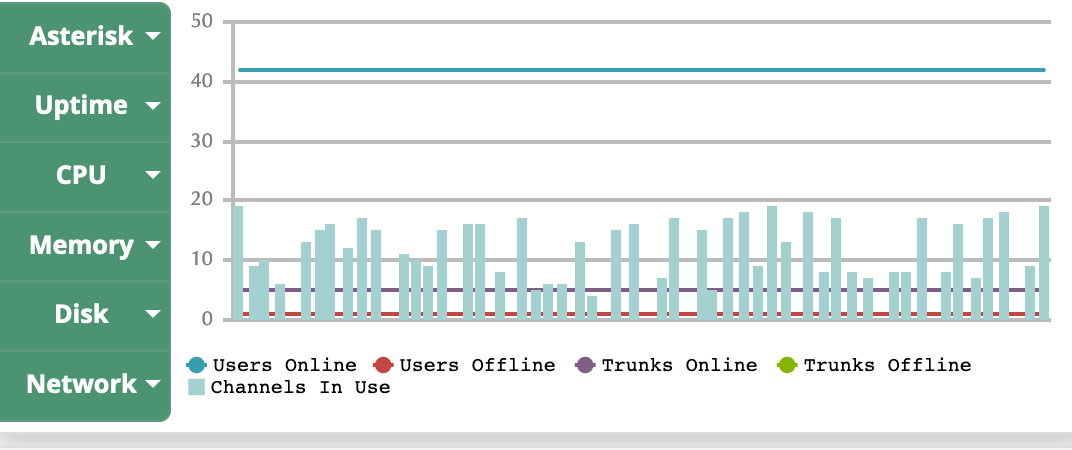
Here are some visuals from pbx, as i am not sure how to get the best historical data yet. Based of work day starting at 730ish and ending at 5pm.
Cynjut,
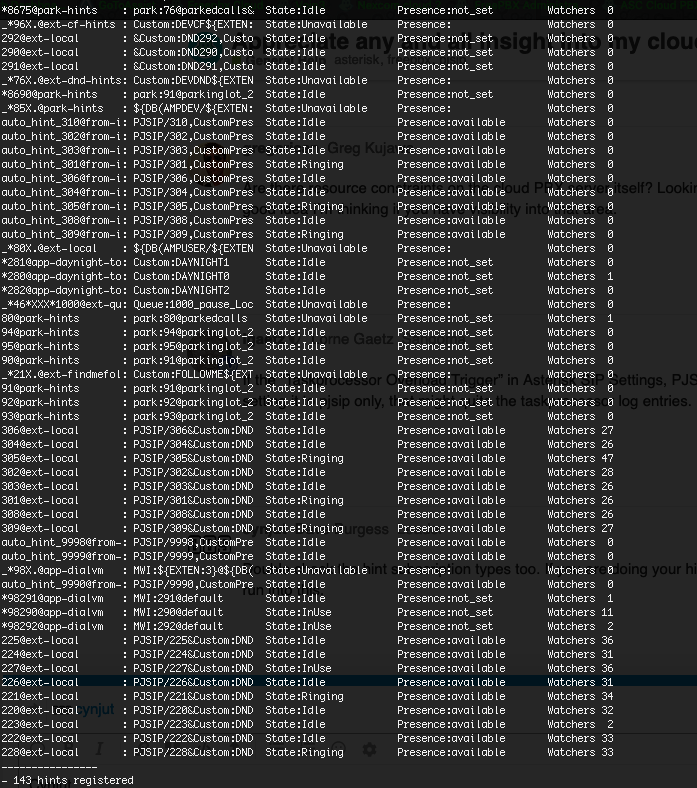
checked everything i could for hints and dont see anything jumping at me. Posting what i found running core show hints in asterisk itself. Maybe to many watchers???
Another update, calling with issues again. Heard them on call. Found this command and am watching it:
rtcp debug stats on
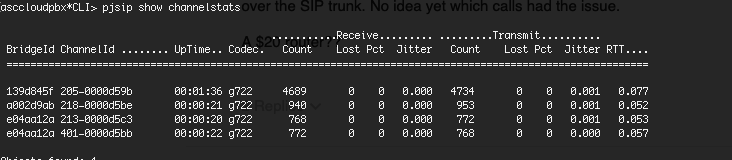
pjsip show channelstats
rtcp debug
Here is quick screen shot, not seeing the jitter or any details on why.