Ok - Almost all my customers are in a similar situation as far as their setup:
Desk Phones -> Local ISP -> Internet -> FreePBX Hosted at Vultr -> Internet -> Trunking Provider
Here is my question - Do you all know any way (with a Linux Box at the Customer Site) that I could isolate where the problem is actually coming from? Some cool Linux utility that looks at the Network Hops and can break them out as to where we are being let down?
I know I could use Traceroute to show me the times on the individual hops, but I need more info than that - basically I need to be able to isolate who is dropping the ball on the connections.
I am hoping there is a utility/suite that I could run on the On-Premise Box and the Co-Located box that would provide the smoking gun - i.e.:
Customer Site to Vultr Miami - Perfect
Vultr Miami to ITSP - High Latency and dropped packets utilizing Zayo (or Level(3) or whoever)
I just tried to track down a problem I had yesterday and it involved three calls with everyone (the ISP and the Hosting company) claiming there was no problems, and yet the ITSP gives me a MOS score graph for the duration of the call showing it started out good and went downhill until it dropped.
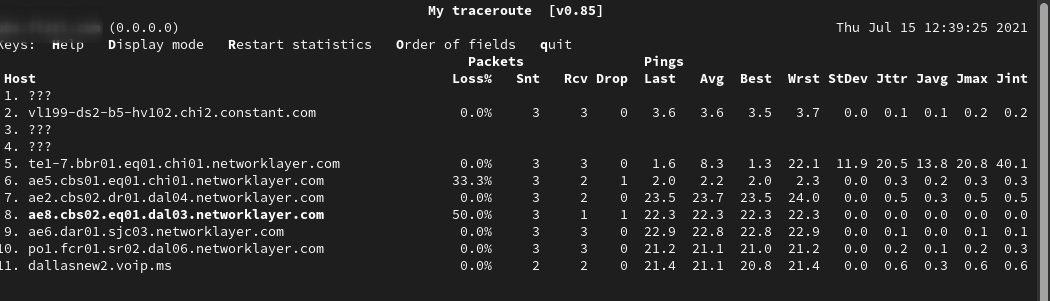
There are hops along your route that do not prioritize ICMP traffic, so you have to keep that in mind when reading the results. Basically what MTR is going to tell you is if there is a hop causing issues that are cascading throughout the rest of the route. If there is a hop that regularly reports back with high ping but the following hops do not, that does not indicate an issue with that hop or your route.
For example, the below MTR shows one hop with very high ping times, but it doesn’t cascade through the rest of the route so there is no issue with that.
Based on my experience, if you are experiencing issues with poor call quality (assuming) it is likely an issue with the local ISP and MTRs should help you to provide info to them that proves it.
Use mtr from your PBX back to the site and from the PBX to the provider. I’m not home to grab an example for a bit, but with the right switches you get jitter calculated as well.
You could also use tcpdump to capture the VOIP traffic on the PBX, then use wireshark to analyze the calls to see which leg of a call is having issues (if not both!)
Also, I use a commercial tool called voipmonitor that runs like that all the time across all our PBX and generates alerts for MOS, fraud alerts, etc. issues. I think the agent component is open source if one doesn’t want to pay for the rest of it.
I have a script that I cron or make a systemd timer for this purpose. Usually once per hour or something. It uses a 60 ping cycle before stopping.
./mtrlog.sh
#!/usr/bin/env bash

if [ $# -ne 1 ]
then
  echo "You must specify a single domain or IP."
  echo "Usage: './mtrlog.sh some.domain.com'"
  exit 0
fi

mtr --report --report-cycles 60 --order LSRDNABWVJMXI $1 > ~/$1_`date +"%Y%m%d-%H%M%S"`.log
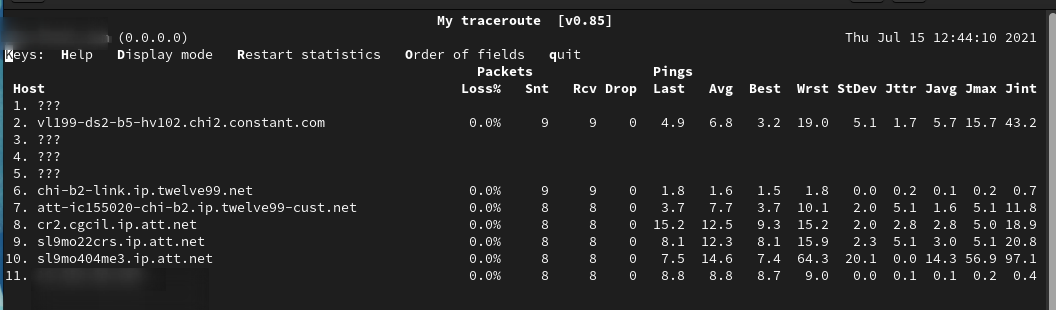
this outputs some.domain.com_YYYYMMDD-HHMSS.log with this content
That’s cool - I wonder (without too much programming) if it could be set to alarm on any rogue values and send an E-Mail when it happens.
I used to subscribe to a service (when we first got into VoIP and SIP Trunking) where they gave us a box, and we could put it on the perspective clients network and let it run for a few days and it would tell us if their connection was solid and stable over time - it was quite pricey (but it worked great) and saved our reputation many times - we would insist on network changes/upgrades until it was happy.
Fast-forward many years and it pretty much was always coming back good (the network here in Albuquerque improved) so we cancelled it because it really was pricey.
But that is what I am looking for - mtr will work fine when I have identified a problem and can trace who to blame, but I really kind of want to set up a monitoring “net” that is running 24/7 at all the customer sites, and on all the hosted FreePBX’s - to tell me who is having problems before I get angry calls.
Vultr says they use mtr to monitor their networks, so that is helpful - I am working on a broader solution.
I am tired of always being blamed when calls don’t sound good - I have invested so much time and effort with the back end and the ITSP that it’s almost always the clients connection or their network, but I have to be able to prove it simply with data that I can give to the offending party so they will fix it.
would help , your various PBI send to a hep capture server realtime stats, the capture server can then separate each call from each PBX and give you some meat to work with
By the last Sangoma Open Source Lounge we had discussed a couple more helpful tools. I think it’s time for a wiki post with all useful troubleshooting tools and “How-to” snippets.