Hi Igor,
Wow, nice!!! We use Nagios for checking all production hosts monitoring, I didn’t know asterisk has SNMP interface.
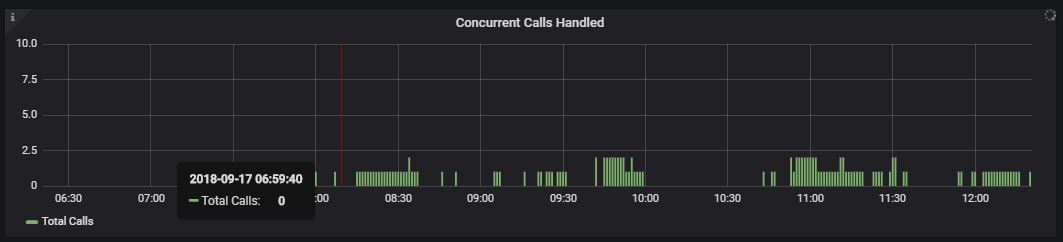
I skimmed through your post, according to Asterisk MIB Definitions, I am assuming your graph is capturing active call, I am wondering is there any MIB to capture calls particularly going through SIP trunk.
astConfigCallsActive OBJECT-TYPE
	SYNTAX		Gauge32
	MAX-ACCESS	read-only
	STATUS		current
	DESCRIPTION
		"The number of calls currently active on the Asterisk PBX."
	::= { asteriskConfiguration 5 }
Thank you very much for sharing great tutorial, I will sit down over the weekend to read through carefully about your work.
I agree it will be nice if we can obtain latency or jitter characteristics via snmp, since my users occasionally report poor call quality and I usually have tough time tracking down what was really happening during the call.
Yea, we used Nagios for the longest time to collect the data and then switched to Zabbix (which I ended up liking a lot better) last year around the time I was trying to figure out SNMP support in Asterisk. Grafana then pulls data from Zabbix to create pretty graphs for us.
I don’t think there is a way to pull the data that you are looking for on individual trunks though. I really do wish SNMP support in asterisk was much more extensive.