We are getting a lot more calls as of late than when I rolled out Asterisk/Freepbx, and I have noticed the call quality is going down as the number of calls goes up. can someone recommend so steps I can do to help this? we are running Current Asterisk Version:** 13.18.3, PBX Firmware:10.13.66-22. how much is to much for FreePBX? I have 8 GB RAM and 4 CPU’s. Thanks for your time and attention. would update to 14 help?
I may have found the issue, somehow the log settings was set to debug. I’m not 100% sure that was the issue, but the CPU is running at an average of 50% now instead of 90%, so here’s hoping!
1 Like
nope that wasn’t it… any other suggestions?
Are you running fop2?
Flash Operator Panel 2? no.
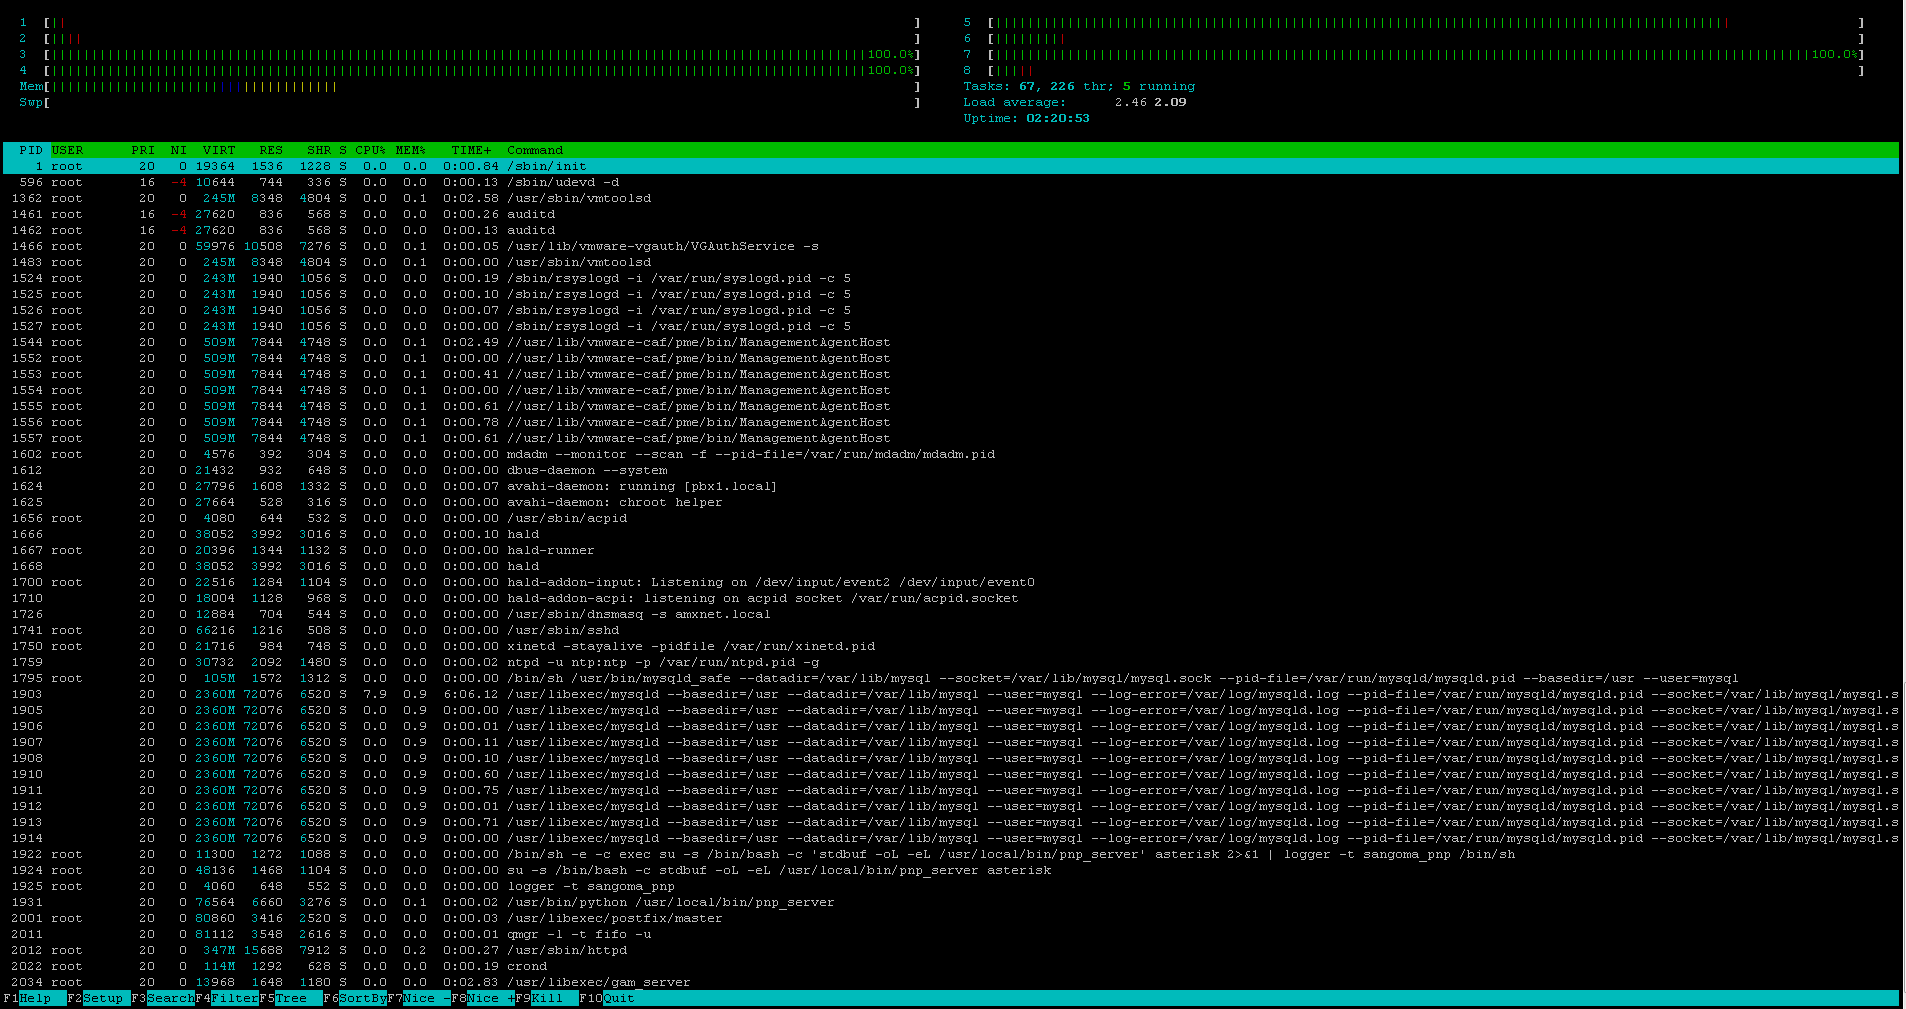
when you run htop from the cli what do you see is consuming your cpu and memory?
Couldn’t copy and past from htop but here is the top of top… 
25531 asterisk 20 0 478m 50m 5508 R 83.7 0.6 0:54.98 httpd
25567 asterisk 20 0 482m 53m 5484 R 82.0 0.7 0:47.42 httpd
25566 asterisk 20 0 482m 53m 5484 R 81.4 0.7 0:30.67 httpd
29145 asterisk 20 0 476m 47m 5460 R 73.7 0.6 0:11.40 httpd
25565 asterisk 20 0 482m 53m 5484 R 66.8 0.7 0:50.16 httpd
25560 asterisk 20 0 482m 54m 5504 R 63.1 0.7 0:24.43 httpd
25564 asterisk 20 0 478m 50m 5468 R 63.1 0.6 0:29.03 httpd
24887 asterisk 20 0 462m 34m 5488 S 56.1 0.4 0:46.33 httpd
1903 mysql 20 0 2360m 79m 6520 S 55.5 1.0 5:42.25 mysqld
2403 asterisk 20 0 5126m 156m 18m S 52.8 2.0 7:44.05 asterisk
24913 asterisk 20 0 460m 32m 5484 S 36.5 0.4 1:00.87 httpd
29676 asterisk 20 0 475m 45m 4600 R 23.9 0.6 0:00.72 httpd
3130 asterisk 20 0 1246m 340m 9892 S 12.3 4.3 1:34.05 node /var/www/h
29686 asterisk 20 0 478m 48m 4600 R 8.0 0.6 0:00.24 httpd
i’m assuming what comes after the httpd got cut off or does it just end at httpd?
CLick on the CPU% header and do the same thing
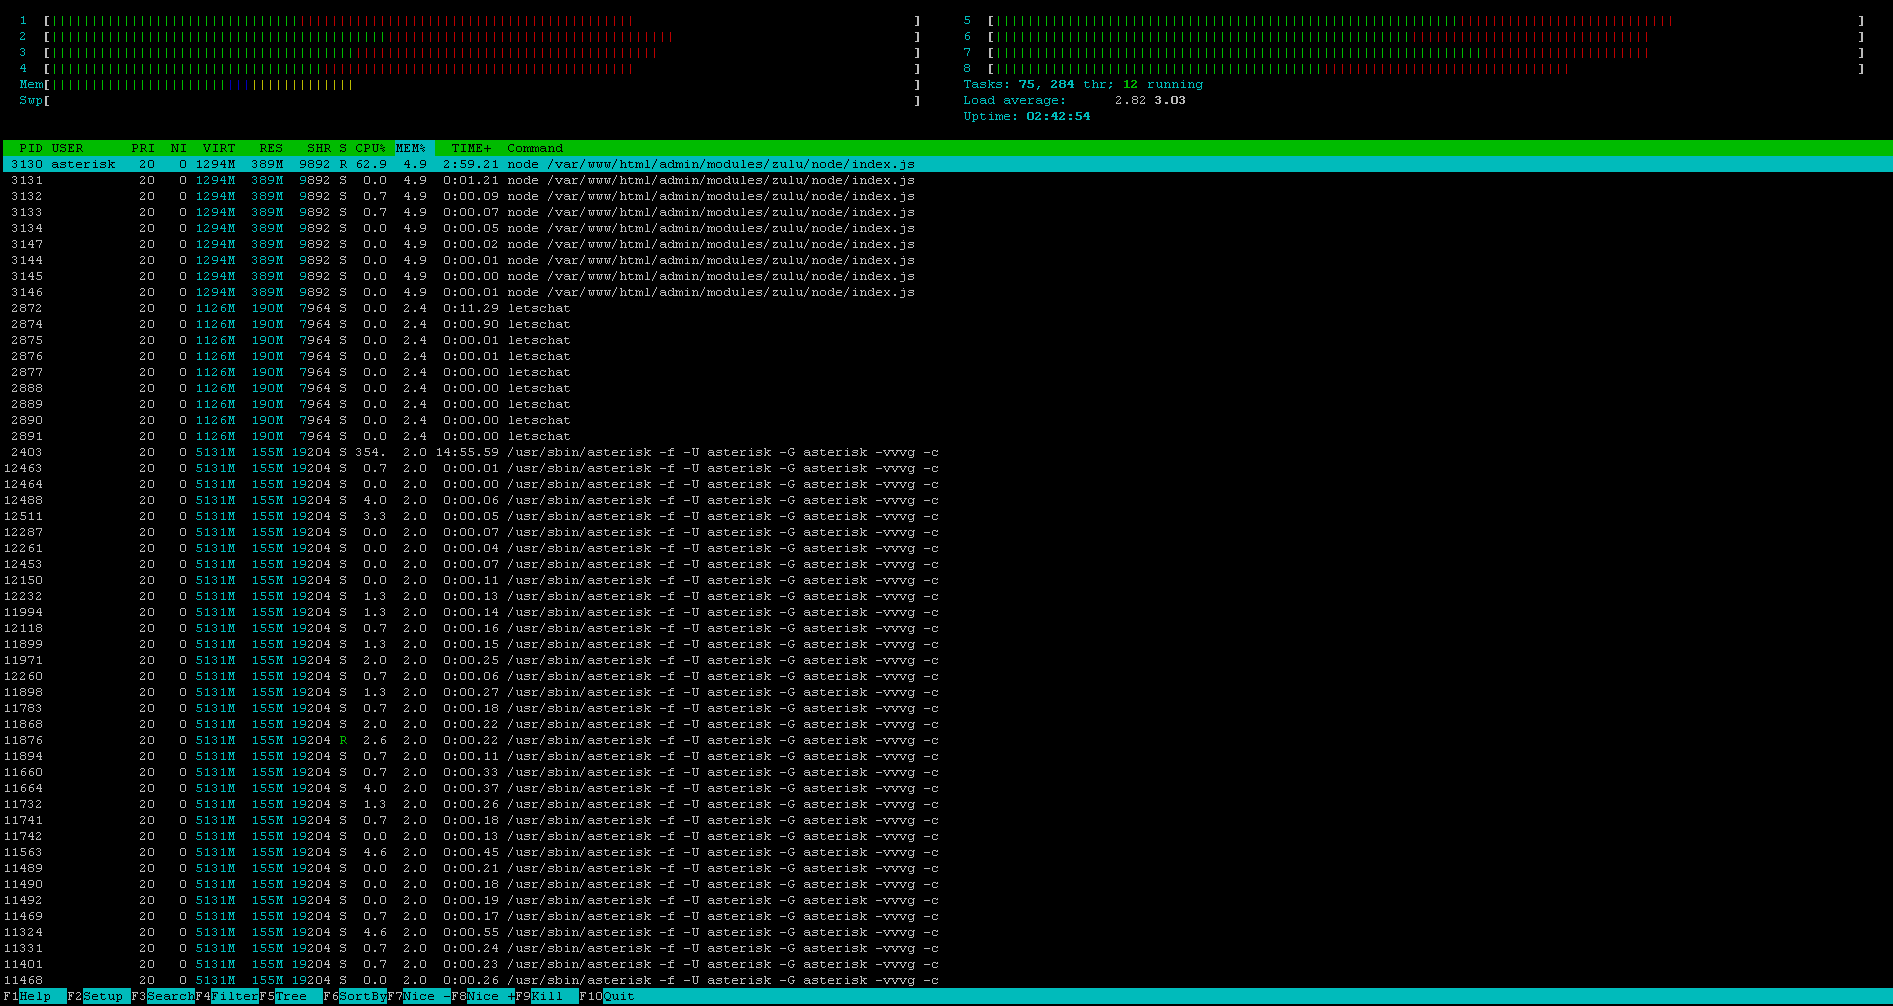
Also click on the Mem header and paste the screen shot
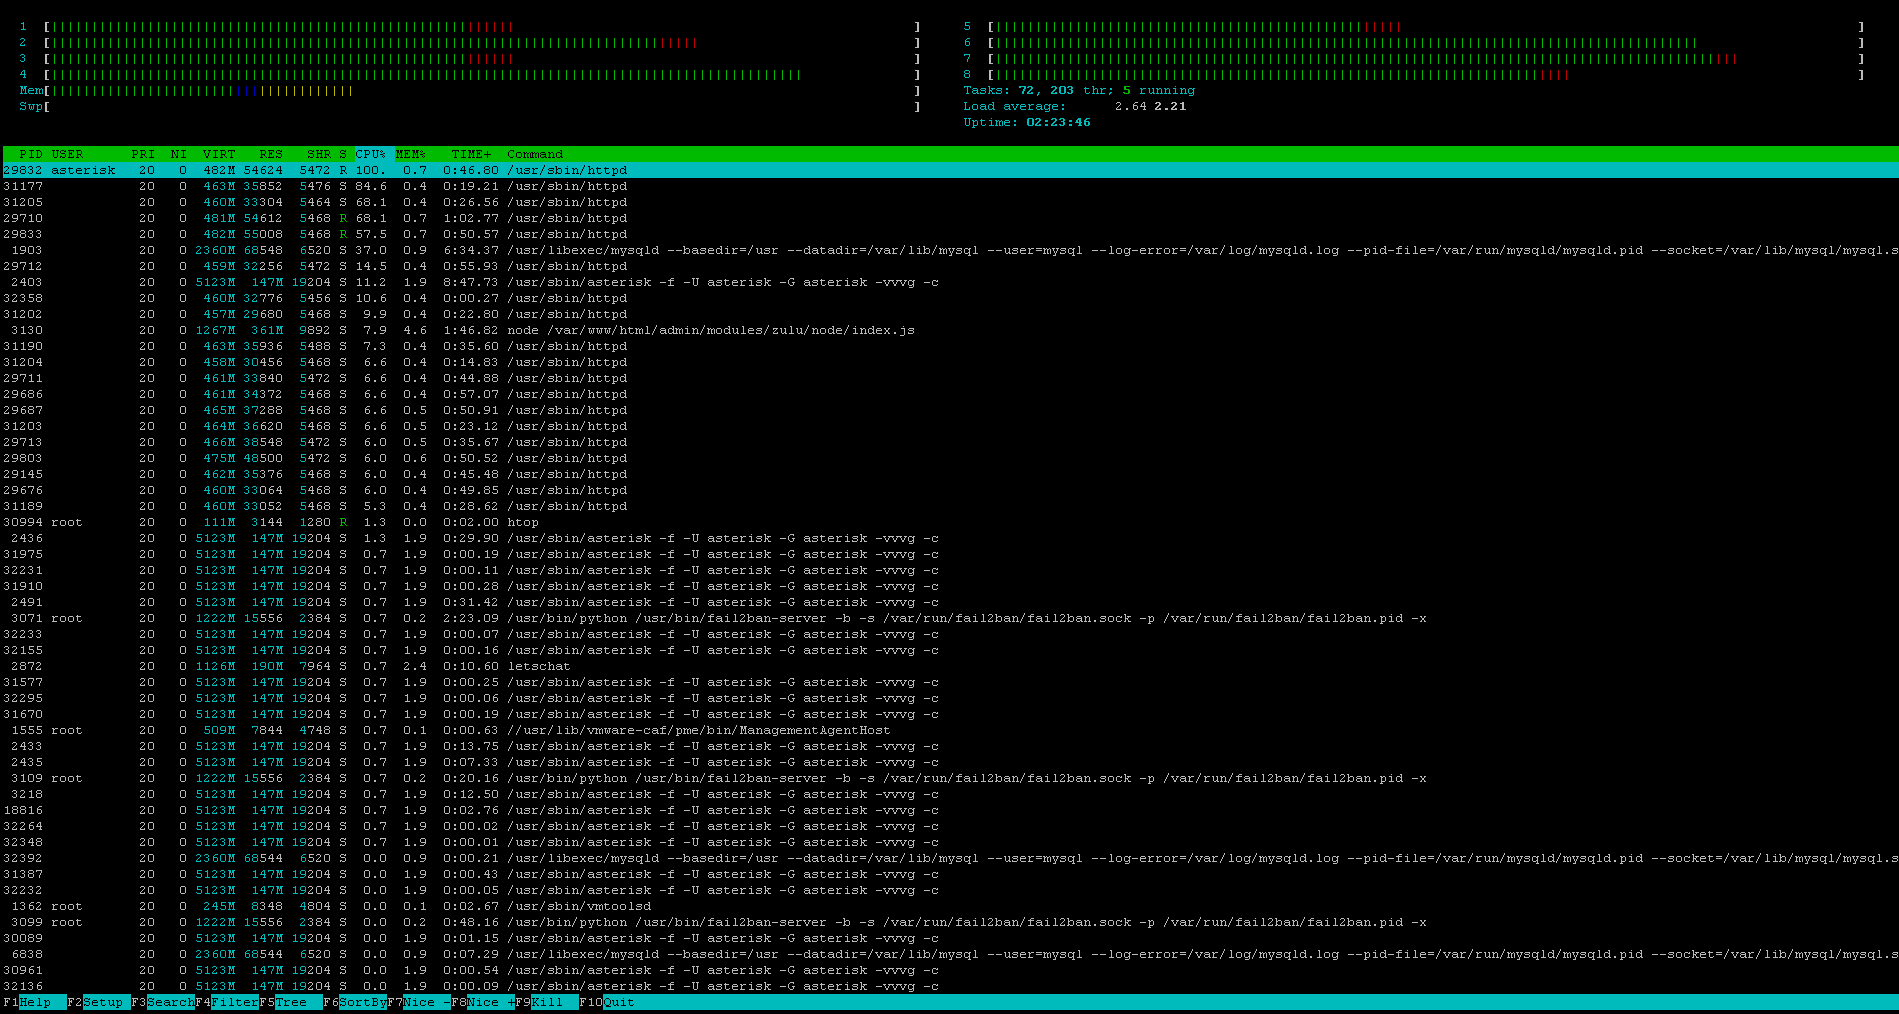
what is the screen shot when you sort by the mem% header?
so just as a side note, it is a little better today. yesterday it was running at 80-95% of CPU almost all day.
If it happens again, run top and press ‘c’ while it’s running, it will show you the full command for each process.
If httpd is cranking your load, that should be easy to diagnose by looking at /var/log/httpd/access_log to see what’s being used. Could be UCP, CDR reports, etc., maybe even a malfunctioning phone app… If your box is exposed to the world with no firewall, it could even be brute force login attempts.
It is behind a firewall and locked down to allow only the two ISP’s IP. I will check out that “C” for top next time I see it.
well, I’m not sure if today was just lighter day than yesterday, but here’s the only thing I did. I reconfigured the server to have two 4 core procs instead of eight 1 core procs… #NothingElseISwear
How many users are in your main ring group/queue?
why is there so much web server usage? how many zulu users do you have?
Also that one asterisk thread@3xx% should ideally not be doing that, do you have a routing loop somewhere?
Edit: also what’s your wait time in regular top?
sorry late to getting back to you, we have 3 different queues, they each have about 10-15 users in each.
14 zulu users, never ran top before the issue showed up, so I have no base line. how would I know if I have a routing loop?