Hi all,
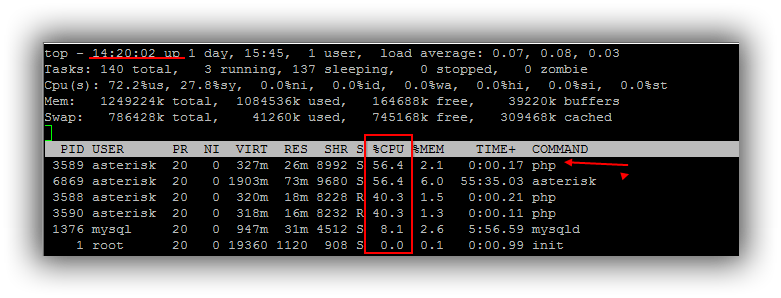
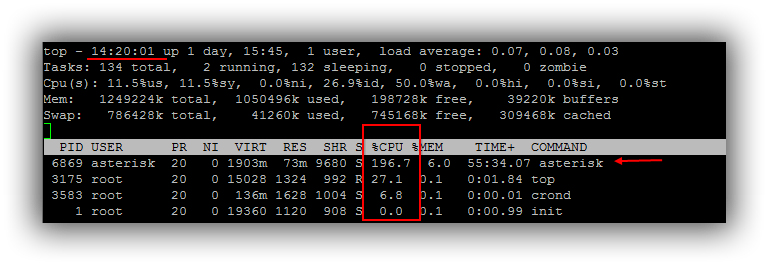
I am migrating the old elastix system to new FreePBX Distro (latest 10.13.66) and I am experiencing strange CPU spikes from time to time even though the system is under no load. Spikes sometimes exceed 100% CPU (more than one fully utilized core).
Could you please point me to a direction, how to figure out, why is this happening? I tried ps -LlFm and pstack with no luck so far. I attach top output.
System has currently configured with cca 250 PJSIP endpoints (cca 150 online).
Thank you.
top - 12:46:03 up  2:51,  2 users,  load average: 0.10, 0.14, 0.13
Tasks: 175 total,   1 running, 174 sleeping,   0 stopped,   0 zombie
Cpu0  : 32.7%us,  4.3%sy,  0.0%ni, 63.0%id,  0.0%wa,  0.0%hi,  0.0%si,
0.0%st
Cpu1  :  9.0%us,  3.3%sy,  0.0%ni, 87.7%id,  0.0%wa,  0.0%hi,  0.0%si,
0.0%st
Cpu2  : 17.9%us,  1.6%sy,  0.0%ni, 74.3%id,  0.0%wa,  0.0%hi,  0.0%si,
6.3%st
Cpu3  : 58.0%us,  2.3%sy,  0.0%ni, 39.7%id,  0.0%wa,  0.0%hi,  0.0%si,
0.0%st
Mem:   3922216k total,  2187576k used,  1734640k free,    93200k buffers
Swap:   786428k total,        0k used,   786428k free,   534736k cached

  PID USER      PR  NI  VIRT  RES  SHR S %CPU %MEM    TIME+  COMMAND
 2061 asterisk  20   0 3021m  88m  16m S 99.0  2.3  17:45.63 asterisk
20974 asterisk  20   0  331m  26m 9056 S  4.3  0.7   0:00.13 php
20950 root      20   0  110m 2444 1252 S  2.7  0.1   0:00.82 htop
 1492 mysql     20   0  947m  40m 6284 S  1.7  1.1   0:36.99 mysqld
 3114 mongodb   20   0  327m  43m  20m S  0.7  1.1   0:33.33 mongod
    4 root      20   0     0    0    0 S  0.3  0.0   0:00.16 ksoftirqd/0
  860 root      20   0     0    0    0 S  0.3  0.0   0:00.39 kauditd
 1746 asterisk  20   0 4607m 484m  18m S  0.3 12.6   2:59.63 java
 2140 root      20   0  323m  16m 9100 S  0.3  0.4   0:06.46 php
20951 root      20   0 15032 1308  948 R  0.3  0.0   0:00.08 top
    1 root      20   0 19360 1500 1196 S  0.0  0.0   0:00.81 init