assuming you’re using VI just enter :q! which will appear at the bottom of the screen and exit the VI terminal.
q = quit
! = do not save changes
assuming you’re using VI just enter :q! which will appear at the bottom of the screen and exit the VI terminal.
q = quit
! = do not save changes
I am curious. Can you please elaborate on what steps you took?
-e means edit , -l means list, so better as
crontab -l
I’m really a newbi at this I downloaded the entire 13 package I believe to a usb drive and installed it on a computer. Then at some point I used the upgrade from the website (probably with yum as that sounds familiar) and upgraded to 15
I’d also try starting with a fresh 15 install as well to make sure that there’s not some upgrade related thing happening if I were you.
Matt
rebooted the system tried to make a change in call routes
tried to hit apply config
still waiting for it to finish(5 Min)
did ps ax
to see what was running there are no cron-d now so why is it taking so long??
Any Ideas please let me know
[root@freepbx ~]# ps ax
PID TTY STAT TIME COMMAND
1 ? Ss 0:04 /usr/lib/systemd/systemd --switched-root --system --d
2 ? S 0:00 [kthreadd]
4 ? S< 0:00 [kworker/0:0H]
6 ? S 0:00 [ksoftirqd/0]
7 ? S 0:00 [migration/0]
8 ? S 0:00 [rcu_bh]
9 ? R 0:06 [rcu_sched]
10 ? S< 0:00 [lru-add-drain]
11 ? S 0:00 [watchdog/0]
13 ? S 0:00 [kdevtmpfs]
14 ? S< 0:00 [netns]
15 ? S 0:00 [khungtaskd]
16 ? S< 0:00 [writeback]
17 ? S< 0:00 [kintegrityd]
18 ? S< 0:00 [bioset]
19 ? S< 0:00 [bioset]
20 ? S< 0:00 [bioset]
21 ? S< 0:00 [kblockd]
22 ? S< 0:00 [md]
23 ? S< 0:00 [edac-poller]
24 ? S< 0:00 [watchdogd]
27 ? S 0:18 [kswapd0]
28 ? SN 0:00 [ksmd]
29 ? SN 0:00 [khugepaged]
30 ? S< 0:00 [crypto]
38 ? S< 0:00 [kthrotld]
40 ? S< 0:00 [kmpath_rdacd]
41 ? S< 0:00 [kaluad]
44 ? S< 0:00 [kpsmoused]
46 ? S< 0:00 [ipv6_addrconf]
59 ? S< 0:00 [deferwq]
94 ? S 0:00 [kauditd]
270 ? S< 0:00 [ata_sff]
275 ? S 0:00 [scsi_eh_0]
277 ? S< 0:00 [scsi_tmf_0]
278 ? S 0:00 [scsi_eh_1]
280 ? S< 0:00 [scsi_tmf_1]
283 ? S 0:00 [scsi_eh_2]
284 ? S< 0:00 [scsi_tmf_2]
285 ? S 0:00 [scsi_eh_3]
286 ? S< 0:00 [scsi_tmf_3]
287 ? S 0:00 [scsi_eh_4]
288 ? S< 0:00 [scsi_tmf_4]
289 ? S 0:00 [scsi_eh_5]
290 ? S< 0:00 [scsi_tmf_5]
292 ? S 0:00 [kworker/u16:3]
296 ? S< 0:00 [ttm_swap]
365 ? S< 0:00 [kdmflush]
366 ? S< 0:00 [bioset]
375 ? S< 0:00 [kdmflush]
376 ? S< 0:00 [bioset]
389 ? S< 0:00 [bioset]
390 ? S< 0:00 [xfsalloc]
391 ? S< 0:00 [xfs_mru_cache]
392 ? S< 0:00 [xfs-buf/dm-0]
393 ? S< 0:00 [xfs-data/dm-0]
394 ? S< 0:00 [xfs-conv/dm-0]
395 ? S< 0:00 [xfs-cil/dm-0]
396 ? S< 0:00 [xfs-reclaim/dm-]
397 ? S< 0:00 [xfs-log/dm-0]
398 ? S< 0:00 [xfs-eofblocks/d]
399 ? S 0:01 [xfsaild/dm-0]
400 ? S< 0:00 [kworker/0:1H]
485 ? Ss 0:02 /usr/lib/systemd/systemd-journald
510 ? Ss 0:00 /usr/lib/systemd/systemd-udevd
511 ? Ss 0:00 /usr/sbin/lvmetad -f
567 ? S 0:00 [jbd2/sda1-8]
568 ? S< 0:00 [ext4-rsv-conver]
574 ? S<sl 0:00 /sbin/auditd
601 ? Ss 0:00 /sbin/rpcbind -w
603 ? Ss 0:01 /usr/bin/dbus-daemon --system --address=systemd: --no
605 ? Ss 0:00 avahi-daemon: running [freepbx.local]
612 ? Ss 0:00 /usr/sbin/incrond
618 ? Ss 0:00 /usr/lib/systemd/systemd-logind
620 ? Ssl 0:00 /usr/lib/polkit-1/polkitd --no-debug
624 ? S 0:00 /usr/sbin/chronyd -f /etc/sangoma_chrony.conf
626 ? S 0:00 avahi-daemon: chroot helper
663 ? S< 0:00 [cfg80211]
861 ? Ss 0:00 /usr/sbin/dnsmasq -k
862 ? Ssl 0:01 /usr/bin/python2 -Es /usr/sbin/tuned -l -P
863 ? Ss 0:00 /usr/sbin/sshd -D
868 ? Ssl 0:06 /usr/bin/redis-server 127.0.0.1:6379
871 ? Ssl 0:01 /usr/sbin/rsyslogd -n
884 ? Ss 0:00 /usr/sbin/xinetd -stayalive -pidfile /var/run/xinetd.
909 ? Ss 0:00 /usr/sbin/httpd -DFOREGROUND
920 ? Ss 0:00 /usr/sbin/crond -n
923 ? Ss 0:00 /usr/sbin/atd -f
931 ? Ss 0:00 login – root
969 ? Ss 0:00 /bin/sh /usr/bin/mysqld_safe --basedir=/usr
1143 ? Sl 0:44 /usr/libexec/mysqld --basedir=/usr --datadir=/var/lib
1342 ? Ss 0:00 /usr/libexec/postfix/master -w
1344 ? S 0:00 qmgr -l -t unix -u
1349 ? Sl 0:12 /usr/bin/mongod --quiet -f /etc/mongod.conf run
1388 ? Ss 0:03 /usr/local/fop2/fop2_server
1468 ? S 0:04 /usr/sbin/httpd -DFOREGROUND
1469 ? S 0:02 /usr/sbin/httpd -DFOREGROUND
1561 ? Ss 0:00 /usr/bin/python /usr/local/bin/pnp_server
1570 ? S 0:00 pickup -l -t unix -u
1588 tty1 Ss+ 0:00 -bash
1709 ? Ss 0:00 sshd: root@pts/0
1713 pts/0 Ss 0:00 -bash
1929 ? S 0:01 /usr/sbin/httpd -DFOREGROUND
1933 ? Ssl 1:03 PM2 v4.5.0: God Daemon (/home/asterisk/.pm2)
2195 ? S 0:03 php /var/www/html/admin/modules/firewall/hooks/voipfi
2277 ? Sl 2:31 /usr/bin/python /usr/bin/fail2ban-server -b -s /var/r
2279 ? S 0:04 /usr/libexec/gam_server
2416 pts/0 S 0:00 /bin/sh /usr/sbin/safe_asterisk -U asterisk -G asteri
2417 ? S 0:00 /bin/sh /usr/sbin/safe_asterisk -U asterisk -G asteri
2422 ? Sl 0:29 /usr/sbin/asterisk -f -U asterisk -G asterisk -vvvg -
2423 pts/0 Sl 0:48 /usr/sbin/asterisk -f -U asterisk -G asterisk -vvvg -
2720 ? S 0:02 /usr/bin/python3.6 -m aiohttp.web aiovega.web:app_fac
3107 ? S 0:00 /usr/sbin/httpd -DFOREGROUND
3160 ? S 0:00 /usr/sbin/httpd -DFOREGROUND
3161 ? S 0:01 /usr/sbin/httpd -DFOREGROUND
3163 ? S 0:16 /usr/sbin/httpd -DFOREGROUND
3165 ? S 0:02 /usr/sbin/httpd -DFOREGROUND
3177 ? S 0:04 voipfirewalld (Monitor thread)
4151 ? Ssl 0:15 node /var/www/html/admin/modules/core/node/fastagi-se
5262 ? Ssl 0:16 node /var/www/html/admin/modules/ucp/node/index.js
7819 ? Ssl 0:24 letschat
8167 ? S 0:00 [kworker/0:2]
8344 ? S 0:00 /usr/sbin/httpd -DFOREGROUND
9631 ? S 0:00 /usr/sbin/httpd -DFOREGROUND
10223 ? S 0:10 php /usr/sbin/fwconsole reload --json
11763 ? R 0:00 [kworker/0:1]
11920 ? S 0:00 [kworker/u16:0]
12259 ? S 0:00 [kworker/u16:1]
12925 ? Dsl 0:06 letschat
14377 ? Rsl 0:00 node /var/www/html/admin/modules/ucp/node/index.js
14427 ? Rsl 0:00 node /var/www/html/admin/modules/pm2/node/node_module
14435 pts/0 R+ 0:00 ps ax
30302 ? S 0:01 [kworker/0:0]
31505 ? S 0:00 /usr/sbin/httpd -DFOREGROUND
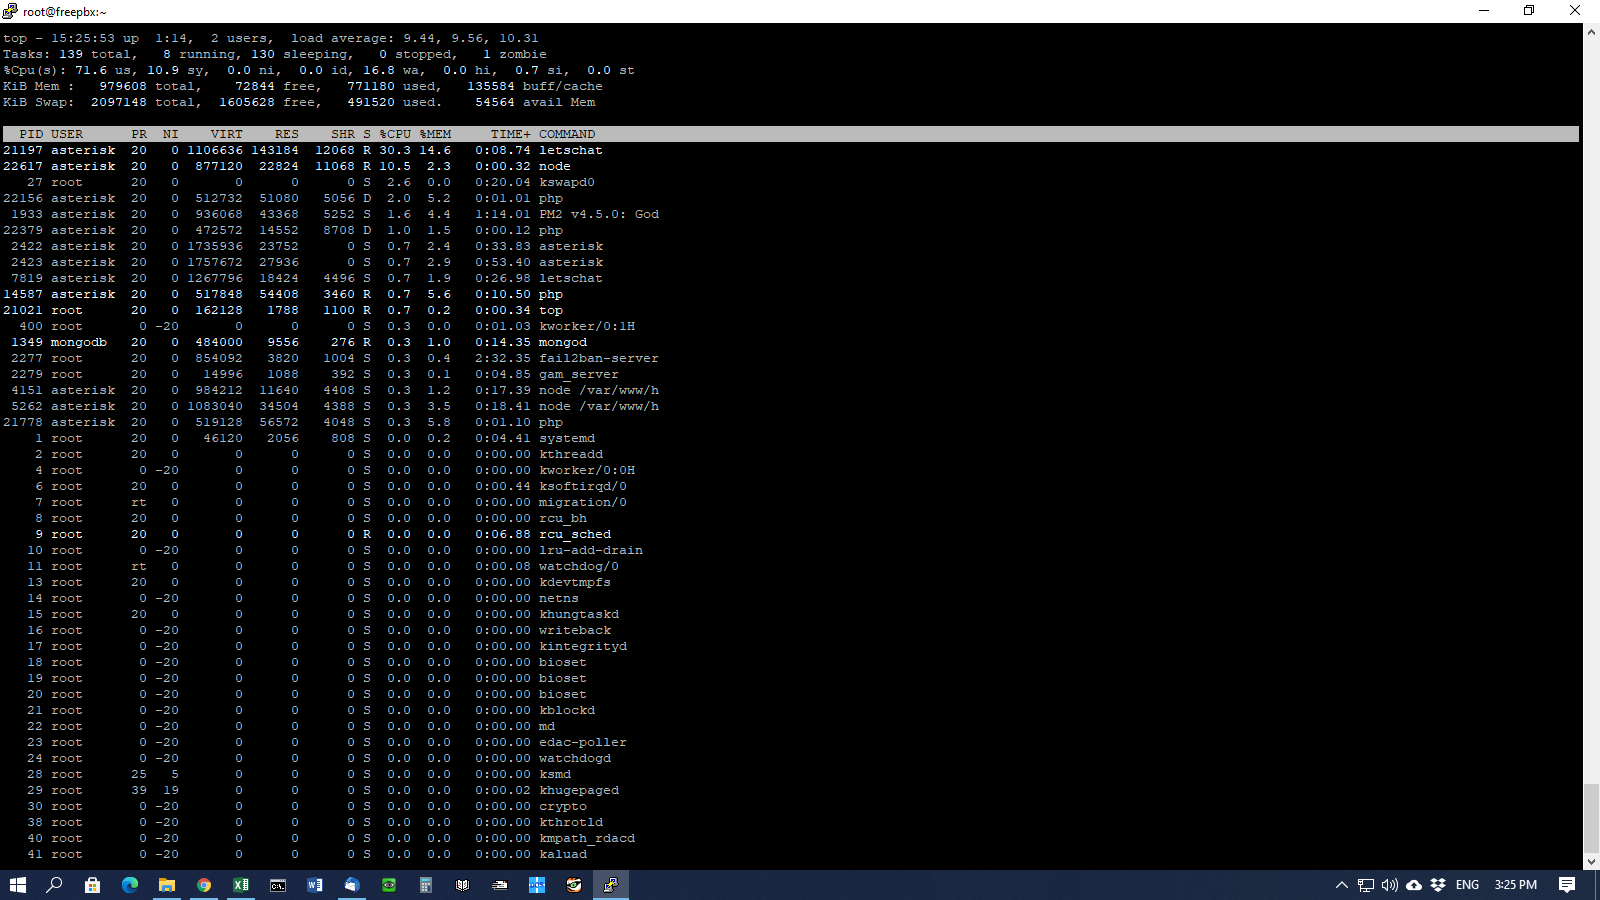
There are two commands you could try: “w” will give you a quick snapshot of your system’s load average, and “top” will show you what’s working and using up CPU and memory.
I’d start with “w” and get the system load average. It just runs one.
The “top” command runs continuously so you can see what’s happening over time.
W
15:23:48 up 1:12, 2 users, load average: 9.38, 9.77, 10.48
USER TTY FROM LOGIN@ IDLE JCPU PCPU WHAT
root tty1 14:12 1:08m 0.02s 0.02s -bash
root pts/0 192.168.0.232 14:12 4.00s 52.28s 0.01s w
You don’t appear to have enough memory. You only appear to have 1GB, and you seem to be using about 500MB of swap space, so the system is quite likely thrashing. I’m not sure I’d want to see any swap used on an Asterisk system. If you can see the disk activity light and it is on solid, you are thrashing.
You don’t say how many cores you are using, so I can’t tell whether the load average figures are of concern, but they feel large to me. That would indicate inadequate CPU power.
A load average of 9 means that there are (on average) 9 processes waiting for resources. Anything above 1 is worth concern. Anything above 2 will cause significant system lag. This machine is WAY under powered for your application.
what yo are saying is possible as I am using an old xp machine as the server. However it has worked for since september without any real issues and we haven’t really added any users to the system. I did delete all voicemails recently that should have helped. You think I am better off starting with a new machine and going from there??
I would never say that, because I don’t know your economic or technological access level, however…
This machine is not going to cut it for what you are doing. There is not nearly enough memory and I’m guessing you’re probably a core or three short for how the system works now.
I think load average includes running processes, which is why the number of cores matters.
With so little RAM, I think you need to “noload” all the modules you aren’t loading. During a reload, their code will need to be read into memory, even if it just to find that their configuration file is empty.
Nope. This is one of the courses I taught at the University of Nebraska. Load average is the average number of processes waiting for access to resources on the process queue between context switches. That’s why it’s never 0. Even with only one program running on the processor, the LA will always have some value larger than 0. At 9, that means that at any given moment, there are 9 programs waiting in the process run queue for resources to be released to the programs.
The number of cores matters because each core can be assigned programs which will then run until the next mandatory context switch. If you have enough cores, then each processor will retain its stack frame settings and not have to context switch, putting the context frame at the end of the “ready” queue.
Your analysis is otherwise right, though. This machine clearly doesn’t have nearly enough RAM. Even without the “noload” modules, there aren’t going to be enough resources to proceed.
That doesn’t agree with the result of asking Google “linux load average”
If you have 1G of physical memory but assign 20G of swap space, you should not be surprised that your load average hits 10, It’s just plain NOT_UNDERSANDING_IT ! and all this on XP with all its native 16bit abilities !!! WTF dude $5/month for a cloud server perhaps? )
If you use atop, you will also see the network and disk usage at the same time as the CPU and memory usage of the processes.
That’s my understanding of that world (and I’ve got a background in linux kernel development) last time I checked.
Load average is number of processes available to run at a given time (so not waiting, sleeping, etc). My rule of thumb is that if it exceeds number of CPUs on the system for more than a short period of time that’s not good.
Matthew Fredrickson
This topic was automatically closed 30 days after the last reply. New replies are no longer allowed.